Claude Code observability: Best practices for tracking and setup
Claude Code observability: What to track, which setup to choose, and how to avoid overbuilding
When Claude Code usage outpaces visibility, teams quickly face rising costs and governance risks. Because AI coding assistants are now embedded in real engineering workflows, you need clear answers to basic questions: Who is using it, what it costs, and which tools are invoked. This guide explains how to establish lightweight observability, detailing what metrics to track first, common setup paths, and how to make usage traceable without over-engineering your stack.
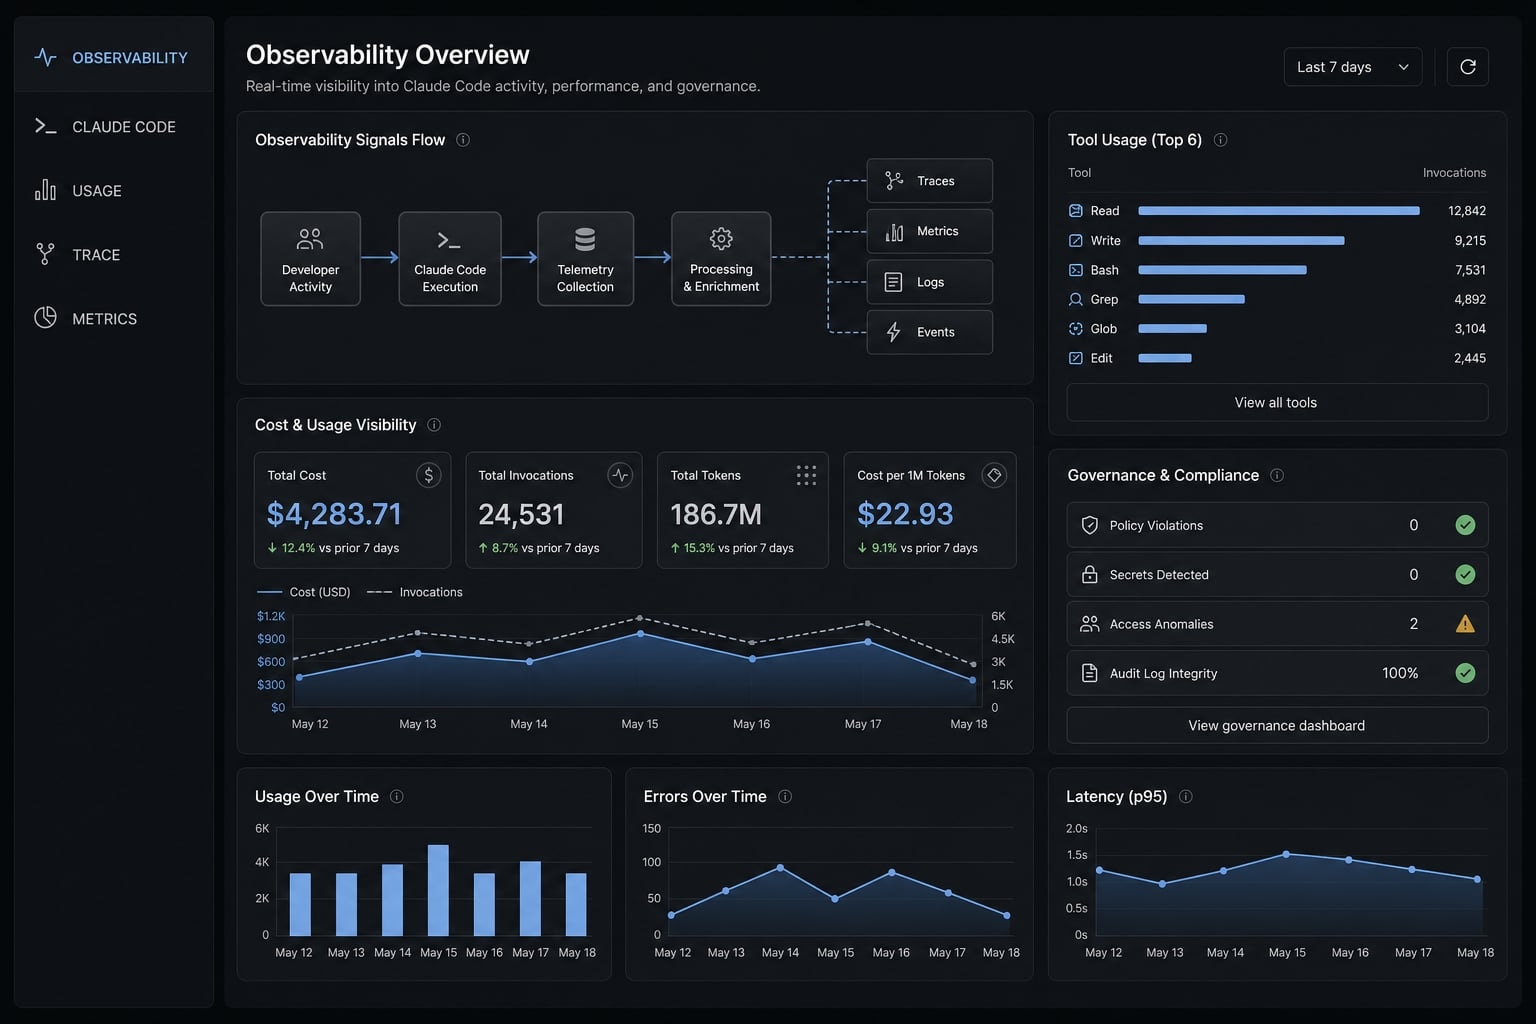
What Claude Code observability actually means
Claude Code observability is the practice of making agent usage measurable, reviewable, and attributable across users, projects, and sessions. It helps teams understand who used the agent, what it did, what it cost, how a session unfolded, and what can be reviewed or audited later if something goes wrong.
In practical terms, Claude Code observability is not just about collecting data. It is about turning agent activity into operational signals that support cost control, workflow analysis, and governance. Teams often start with local logs or raw hook outputs, then realize they still cannot answer cross-project questions or compare usage patterns across developers.
That is where AI coding agent instrumentation matters. Once Claude Code is used by more than one person or across multiple repositories, simple files stop being enough. Tracing Claude Code agent behavior requires a structure that can capture session context, tool calls, timing, and attribution. This is also why OpenTelemetry is increasingly relevant: It gives teams a standard way to export and route telemetry without locking themselves into one storage pattern.
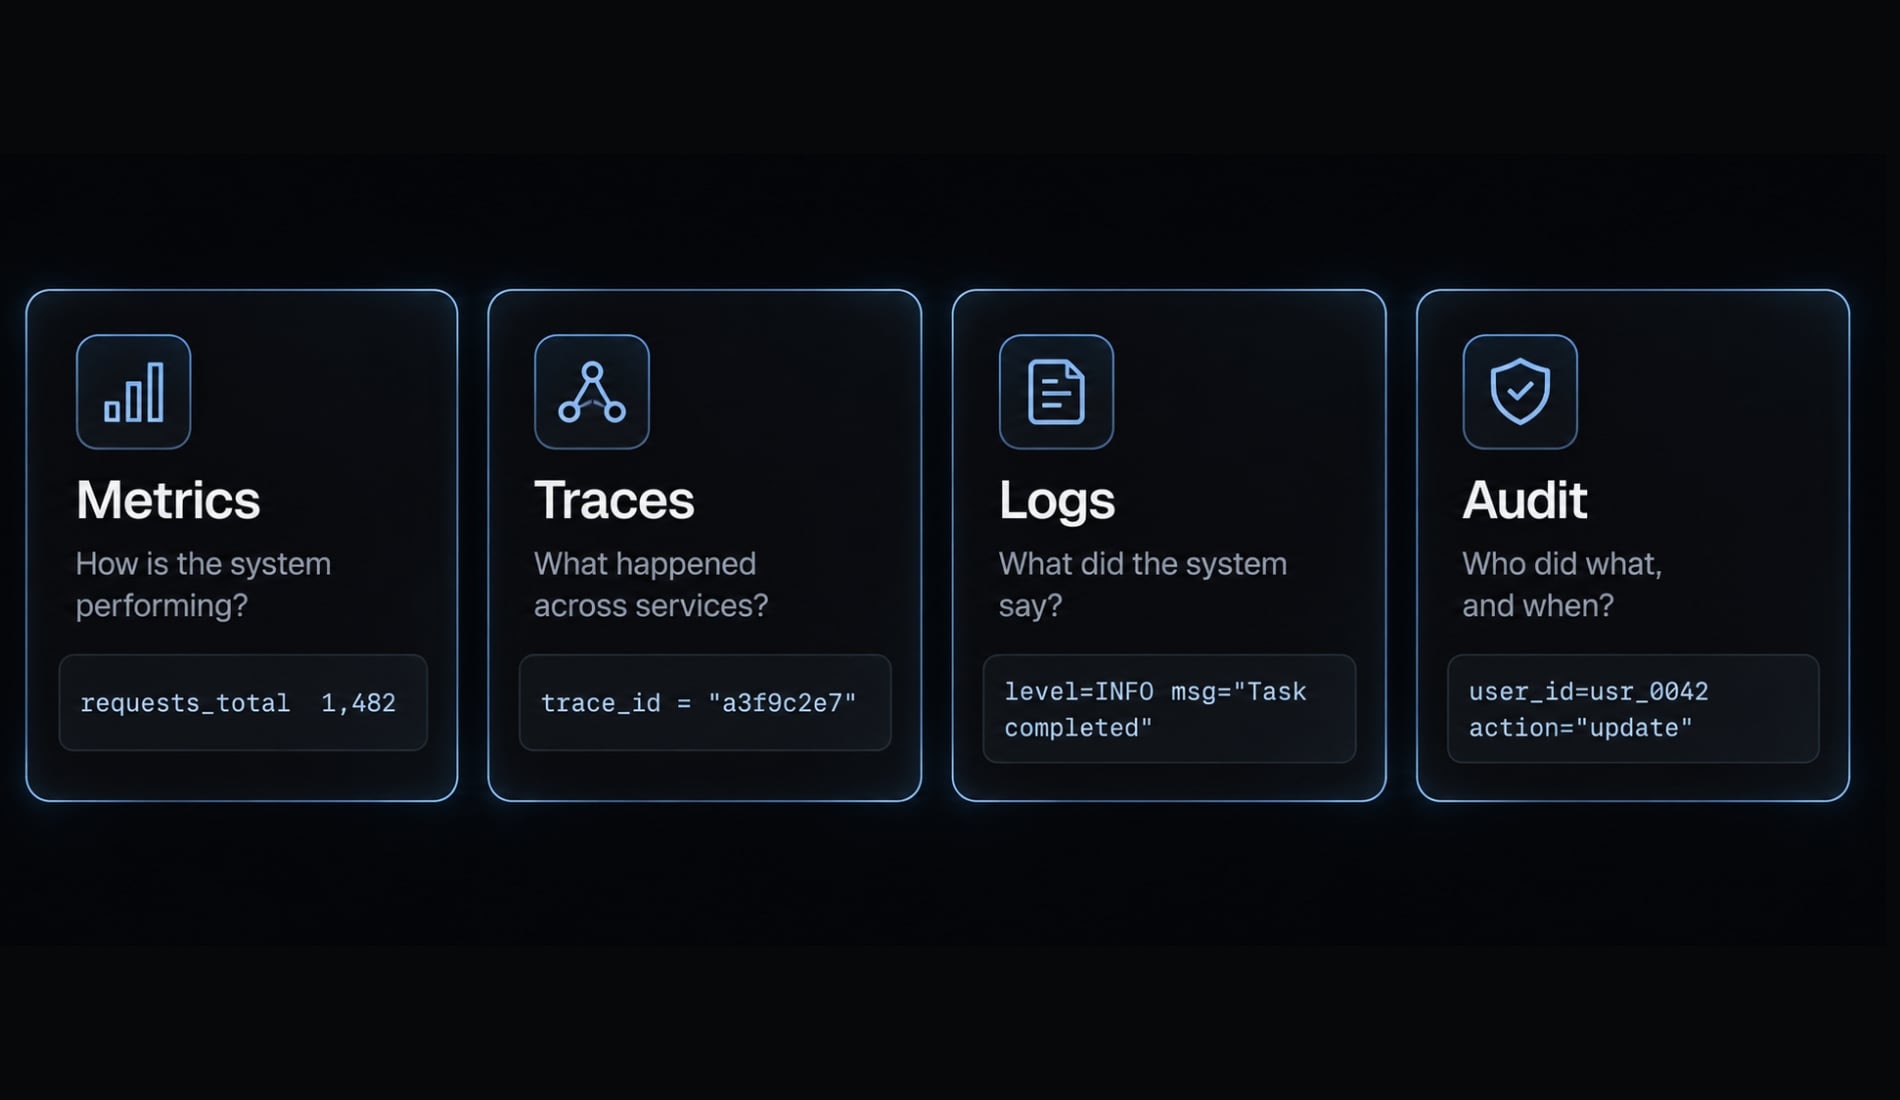
Metrics, traces, and logs answer different questions
Metrics answer “how much, how often, and how expensive.”.
- They help track session count, active users, token usage, and trends over time.
- Practical question: Are we using Claude Code more this month, and which team drives most of the spend?
Traces answer “what happened during a session.”
- They show the sequence of prompts, outputs, tool calls, and step timing.
- Practical question: Which sessions stall, and where does the workflow slow down?
Logs answer “what exactly happened at a specific step.”
- They can show inputs, outputs, and execution events in raw form.
- Practical question: What tool call failed, and what response came back?
Audit events answer “what was approved, triggered, or reviewed.”
- They matter when teams need durable records for access decisions or security investigation.
- Practical question: Which action required approval, and who allowed it?
Logging is not the same as observability
Many teams save markdown or JSON logs from hooks and call that visibility. In reality, they still cannot compare usage across users, projects, or time periods. Logging stores events; observability makes them queryable and operationally useful.
That distinction matters. Claude code observability improves visibility, not model quality by itself. More telemetry is not automatically better telemetry. The right structure for monitoring AI coding assistant telemetry is the one that helps your team make better decisions without creating unnecessary collection risk.
What you should track first in Claude Code
The fastest way to overbuild is to collect everything before deciding what decisions the data should support. A better approach is to phase maturity. Start with the signals that answer business and engineering questions first, then expand only when the next layer becomes operationally useful.
- Session count and active users.
- Token usage and cost.
- Tool calls and step timing.
- Prompt/output traces.
- Approvals, retention, and redaction controls.
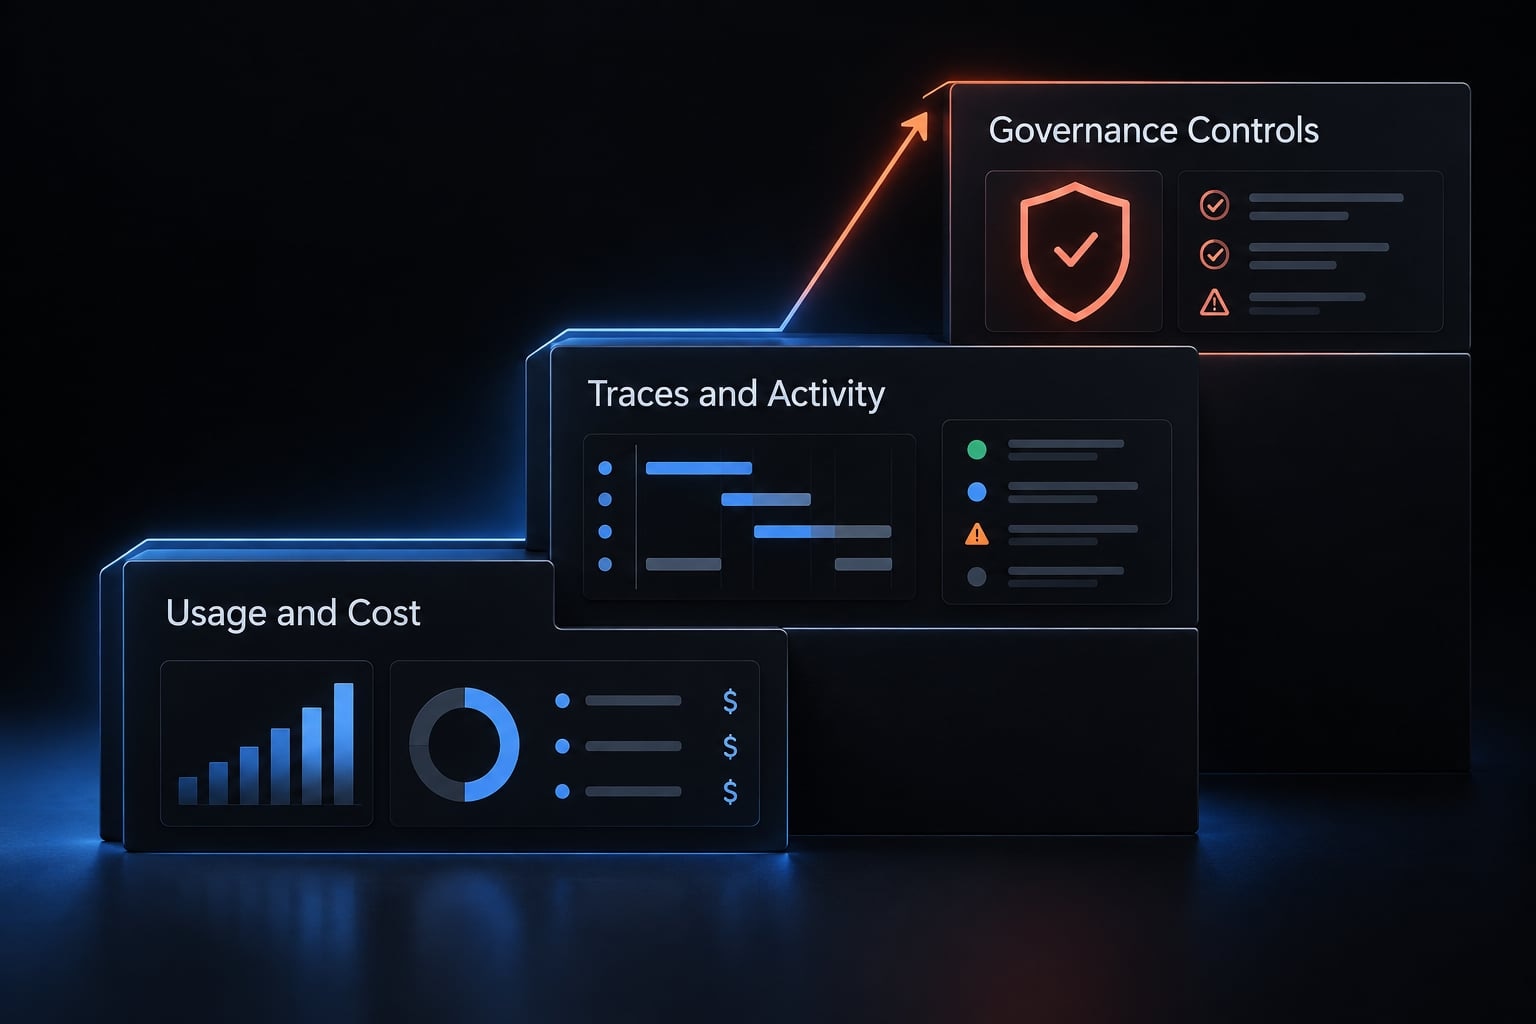
Phase 1 - Start with usage and cost visibility
Phase 1 should focus on basic telemetry that supports adoption tracking and budget visibility. For most teams, this is the minimum viable layer.
Track:
- Session volume.
- Active users.
- Token usage.
- Cost by user, team, or project where possible.
This is the foundation for monitoring AI coding agent token consumption and costs. It helps technical founders and engineering leads answer straightforward management questions:
- Which team is generating most of the spend?
- Is usage actually increasing, or just concentrated in a few users?
- Are we getting broad adoption or only isolated experimentation?
The value here is not sophistication. It is operational clarity. Without this layer, ROI conversations quickly become subjective.
Phase 2 - Add traces and tool activity
Phase 2 should add enough detail to explain how sessions work, not just how often they happen. This is where tracing Claude Code agent behavior becomes useful.
Track:
- Prompts.
- Outputs.
- Tool invocations.
- Step timing.
- Session flow from start to finish.
This enables tool call monitoring and supports Claude Code performance auditing in a practical sense. Teams can begin to debug workflow friction, identify productive prompt patterns, and understand where time is being lost.
Useful questions at this stage include:
- Where do sessions stall?
- Which tools are slowing the workflow?
- Which prompt patterns consistently produce usable output?
This phase improves workflow optimization and developer effectiveness. It also helps teams distinguish between high activity and productive activity.
Phase 3 - Add governance controls only when needed
Phase 3 is where approvals, retention rules, redaction, and sensitive payload handling become more important. This is the layer that improves auditability, but it should be added proportionately.
Track or define:
- Approval-related events.
- Data retention periods.
- Redaction rules.
- Sensitive input/output handling.
- Access boundaries for stored telemetry.
This stage supports:
- Compliance readiness.
- Access control.
- Operational risk management.
- More formal Claude Code performance auditing.
The important caveat is simple: Do not treat this as mandatory for every small team on day one. Governance controls should be added when maturity and risk justify them, not by default. Broad prompt capture without policy, retention boundaries, or review ownership can create more risk than value.
If your team is trying to define a practical starting scope, a simple internal checklist is often enough to avoid overcollection before the stack grows. A lightweight observability blueprint usually creates more value than a full policy package too early.
The 4 most common Claude Code observability setups
There is no single best implementation path. Teams usually move from lightweight capture toward more structured telemetry as usage expands. The right choice depends less on feature lists and more on maturity, existing stack, and governance needs.
Setup path | Best for | What you get | Main trade-off | Operational fit |
|---|---|---|---|---|
Local logs / hooks | Solo developers | Basic session capture | Weak queryability and governance | Low maturity |
Self-hosted tracing | Solo devs, small teams | Session traces, prompt history, tool usage | Infra maintenance | Medium maturity |
OTLP to existing stack | Startups, engineering teams | Metrics, dashboards, alerts, attribution | Needs observability familiarity | High leverage if stack exists |
Managed telemetry pipeline | Security-conscious orgs | Routing, redaction, storage control, multi-destination export | Higher setup complexity | Higher maturity / compliance needs |
Lightweight local logging or hook-based capture
This is the simplest starting point. A hook-based capture pattern can store local prompts, responses, or execution events for later review.
Best fit:
- Solo validation.
- Local experimentation.
- Quick review of recent sessions.
Strengths:
- Fast to implement.
- Useful for personal replay.
- Minimal infrastructure.
Limitations:
- Weak querying across projects.
- Poor team-wide visibility.
- Minimal support for governance or attribution.
The trade-off is clear: This setup is good for proving the need, but weak once usage spreads beyond one developer.
Self-hosted tracing stack such as Langfuse
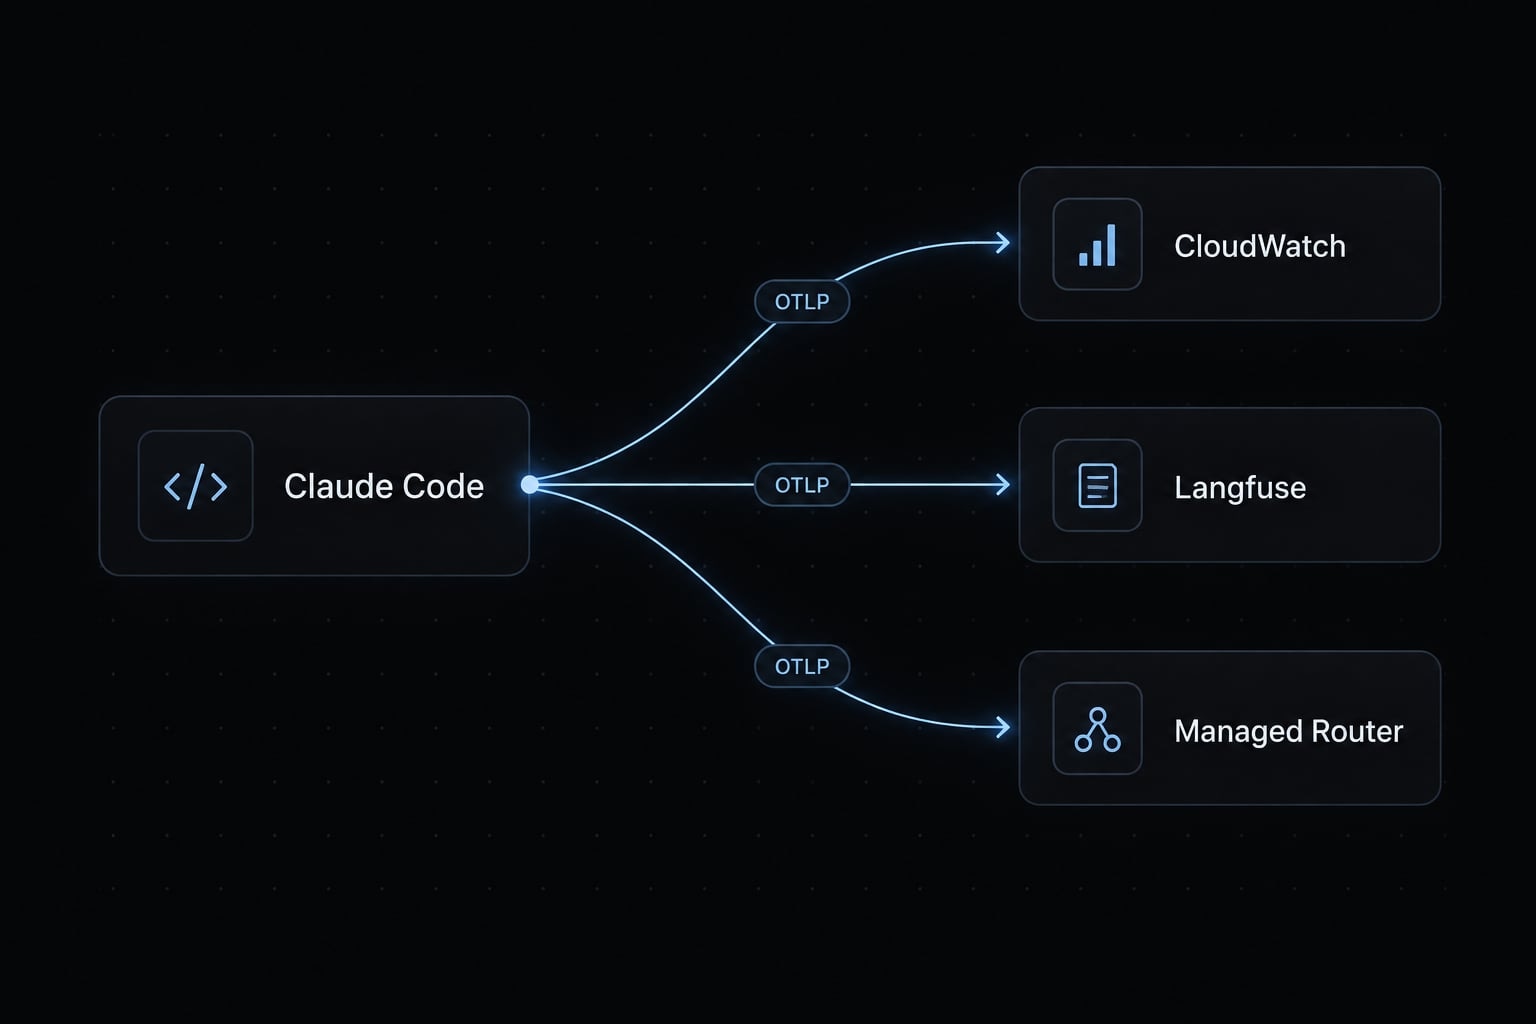
A self-hosted tracing workflow gives teams more structured visibility. Tools such as Langfuse are often used to capture session history, traces, prompt patterns, and tool usage in a more queryable form.
Best fit:
- Solo founders who want history and replay.
- Small teams that need better structure than raw files.
- Teams that want more control over data location.
Strengths:
- Session replay and chronology.
- Structured traces.
- Better tool usage visibility.
- More control than local logs.
Limitations:
- Requires infrastructure.
- Ongoing maintenance overhead.
- Still needs clear retention decisions.
The trade-off is better visibility in exchange for operational upkeep.
Existing observability stack via OTLP export
For teams that already run telemetry infrastructure, this is often the highest-leverage option. OTLP and OpenTelemetry compatibility make it possible to export Claude Code metrics into existing dashboards, alerting systems, and attribution views.
A common example is Claude Code observability with OpenTelemetry and CloudWatch, where teams push usage data into Amazon CloudWatch for centralized reporting. More broadly, this pattern works well anywhere OTLP-compatible export fits an existing monitoring environment.
Best fit:
- Startup engineering teams.
- Platform teams with established observability practices.
- Teams that need centralized views quickly.
Strengths:
- Shared dashboards.
- Alerts.
- Cost attribution.
- Better alignment with current workflows.
Limitations:
- Requires observability familiarity.
- Initial signal design still matters.
- Can be noisy if telemetry is poorly scoped.
The trade-off is strong leverage if the stack already exists, but weak returns if ownership is unclear.
Managed routing/control-plane approach
Some organizations need more than collection. They need routing, policy, and storage control. That is where a managed layer for secure routing Claude Code OTLP telemetry data becomes useful.
A recognized example of this pattern is Bindplane, used neutrally here as a model for teams that want to route data to multiple destinations, apply redaction, and manage control at the pipeline level.
Best fit:
- Security-conscious engineering organizations.
- Teams with multiple telemetry destinations.
- Environments with stronger governance demands.
Strengths:
- Routing control.
- Redaction support.
- Storage flexibility.
- Multi-destination export.
- Higher confidence in governance.
Limitations:
- More setup complexity.
- Requires operational ownership.
- Often unnecessary for small teams.
The trade-off is stronger governance and flexibility, but with a higher maturity threshold.
How to choose the right setup for your workflow
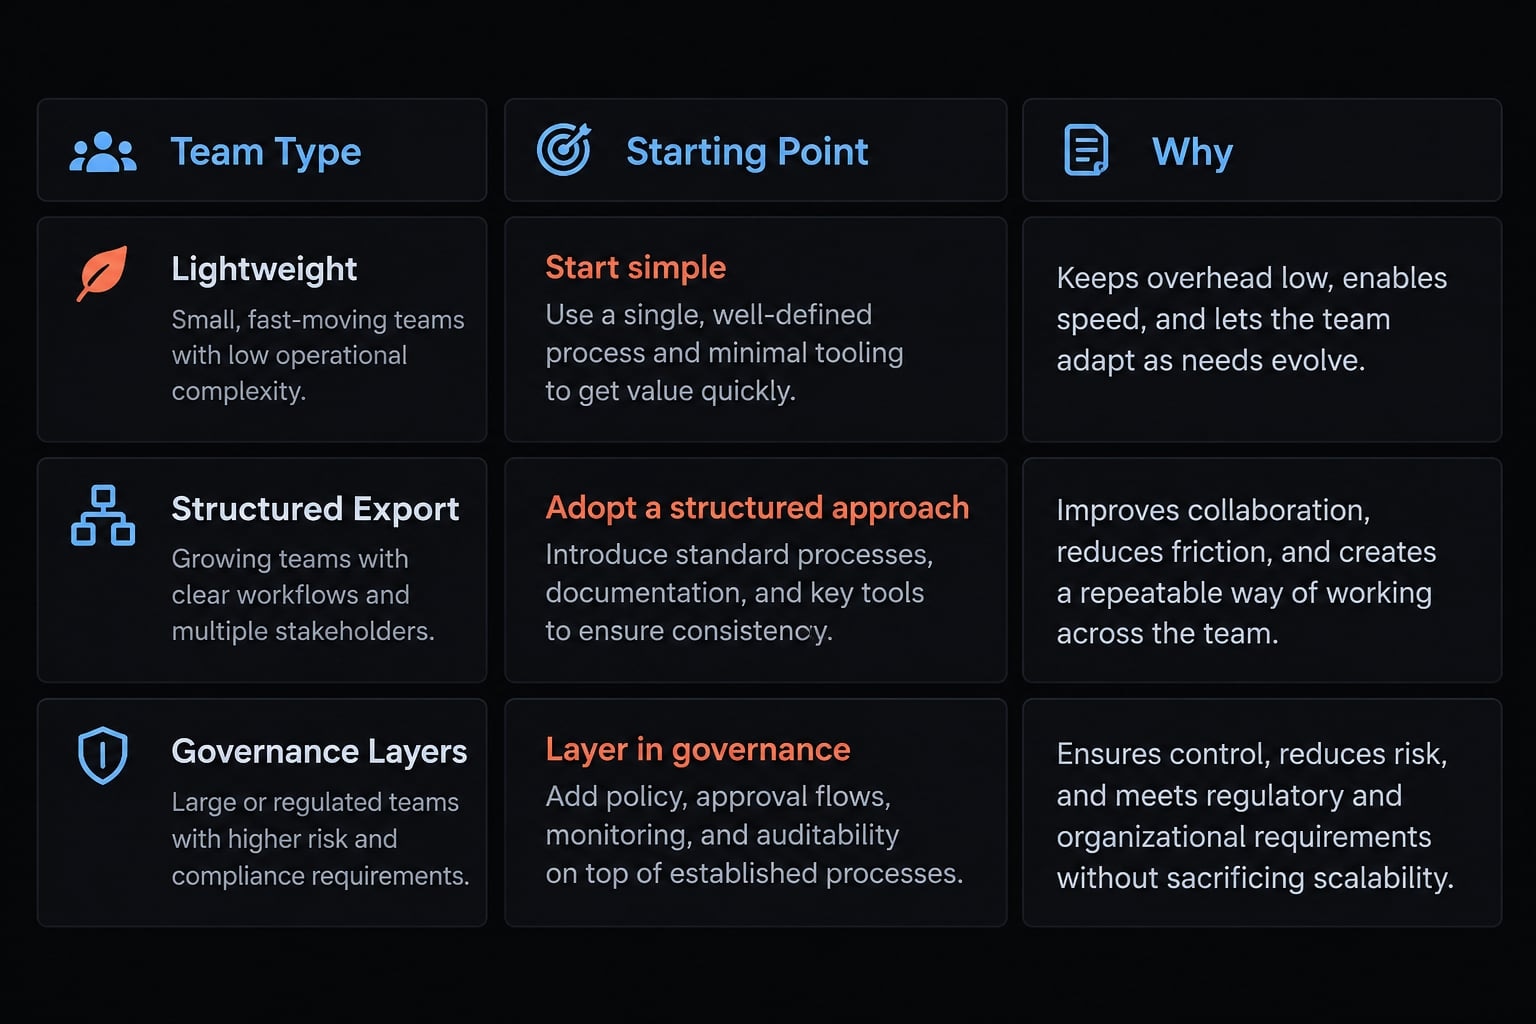
Choose based on constraints, not features. The best practices for AI coding agent auditing and logging usually come down to one question: What level of visibility do you need relative to your team size, current stack, and governance exposure?
A practical heuristic:
- If simplicity matters most → Start lightweight.
- If team visibility matters most → Use structured export.
- If control and compliance matter most → Add routing and governance layers.
If you are a solo founder or independent developer
A lightweight capture pattern or self-hosted tracing setup is usually enough.
Priorities:
- Prompt pattern review.
- Session replay/history.
- Lightweight AI coding agent instrumentation.
- Avoid overbuilding dashboards too early.
For this group, the main goal is learning, not full operational maturity.
If you are a startup engineering team
An OTLP-compatible export into an existing telemetry pipeline is usually the most practical choice.
Priorities:
- Cost attribution.
- Adoption visibility.
- Tool usage trends.
- Shared dashboards for engineering leads.
- Better support for developer experience operations.
This is often the point where DIY logging becomes debt. Once multiple users, repos, and teams are involved, ad hoc files stop answering management questions.
If you are a larger or security-sensitive organization
Governance needs should shape the design earlier.
Priorities:
- Redaction.
- Retention policy.
- Role-based access.
- Audit workflow.
- Governance as infrastructure, not an afterthought.
These teams usually need a more structured telemetry pipeline because visibility without control creates avoidable risk.
A practical rollout plan for teams that do not want to overbuild
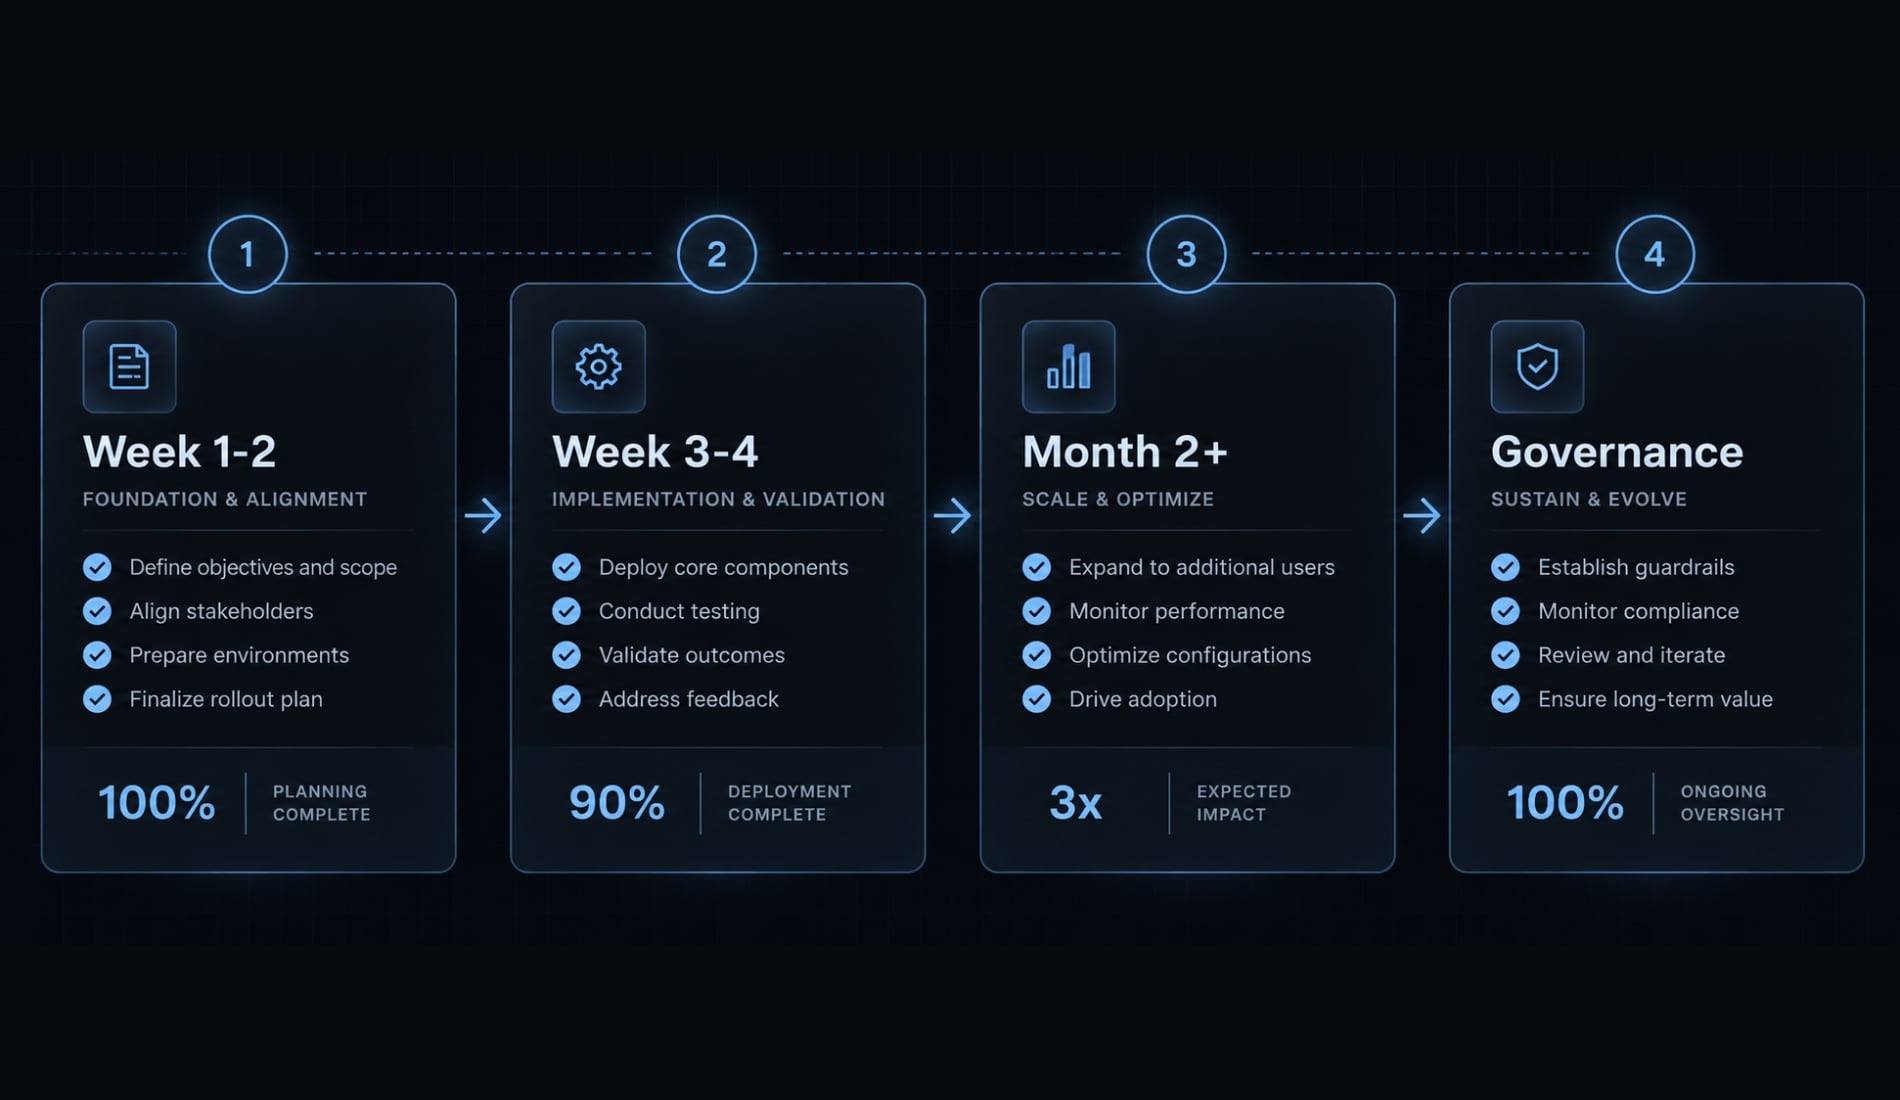
The right rollout starts with one decision question, not one tool. Add only the telemetry needed to answer that question. Expand only after signal quality, ownership, and review processes are clear.
Start with one decision question
Choose the primary decision first:
- Cost control.
- Developer adoption.
- Workflow optimization.
- Security review.
This keeps monitoring AI coding agent token consumption and costs separate from broader workflow questions. It also prevents teams from collecting data without a clear use case.
Add only the signals that answer that question
Use a simple rollout sequence:
- Week 1-2: Capture basic usage and cost telemetry.
- Week 3-4: Add attribution by user, team, or project plus a minimal dashboard.
- Month 2+: Add traces for session flow and tool activity.
- Later, if justified: Add approvals, retention rules, redaction, and secure routing Claude Code OTLP telemetry data.
Broad prompt or payload capture should not happen before a policy exists for retention, access, and sensitive content handling. That is the difference between a right-sized telemetry pipeline and an accidental compliance problem.
How teams operationalize Claude Code observability without rebuilding everything
The biggest failure pattern is rarely missing tools. It is inconsistent workflow design. Claude Code observability often breaks because teams enable telemetry in different ways, store outputs inconsistently, and never define who owns the resulting signals.
Where standardization usually breaks:
- Settings drift across developer machines.
- Ad hoc hooks added without shared review.
- Inconsistent attribution across users or projects.
- No telemetry ownership.
- No shared retention or redaction baseline.
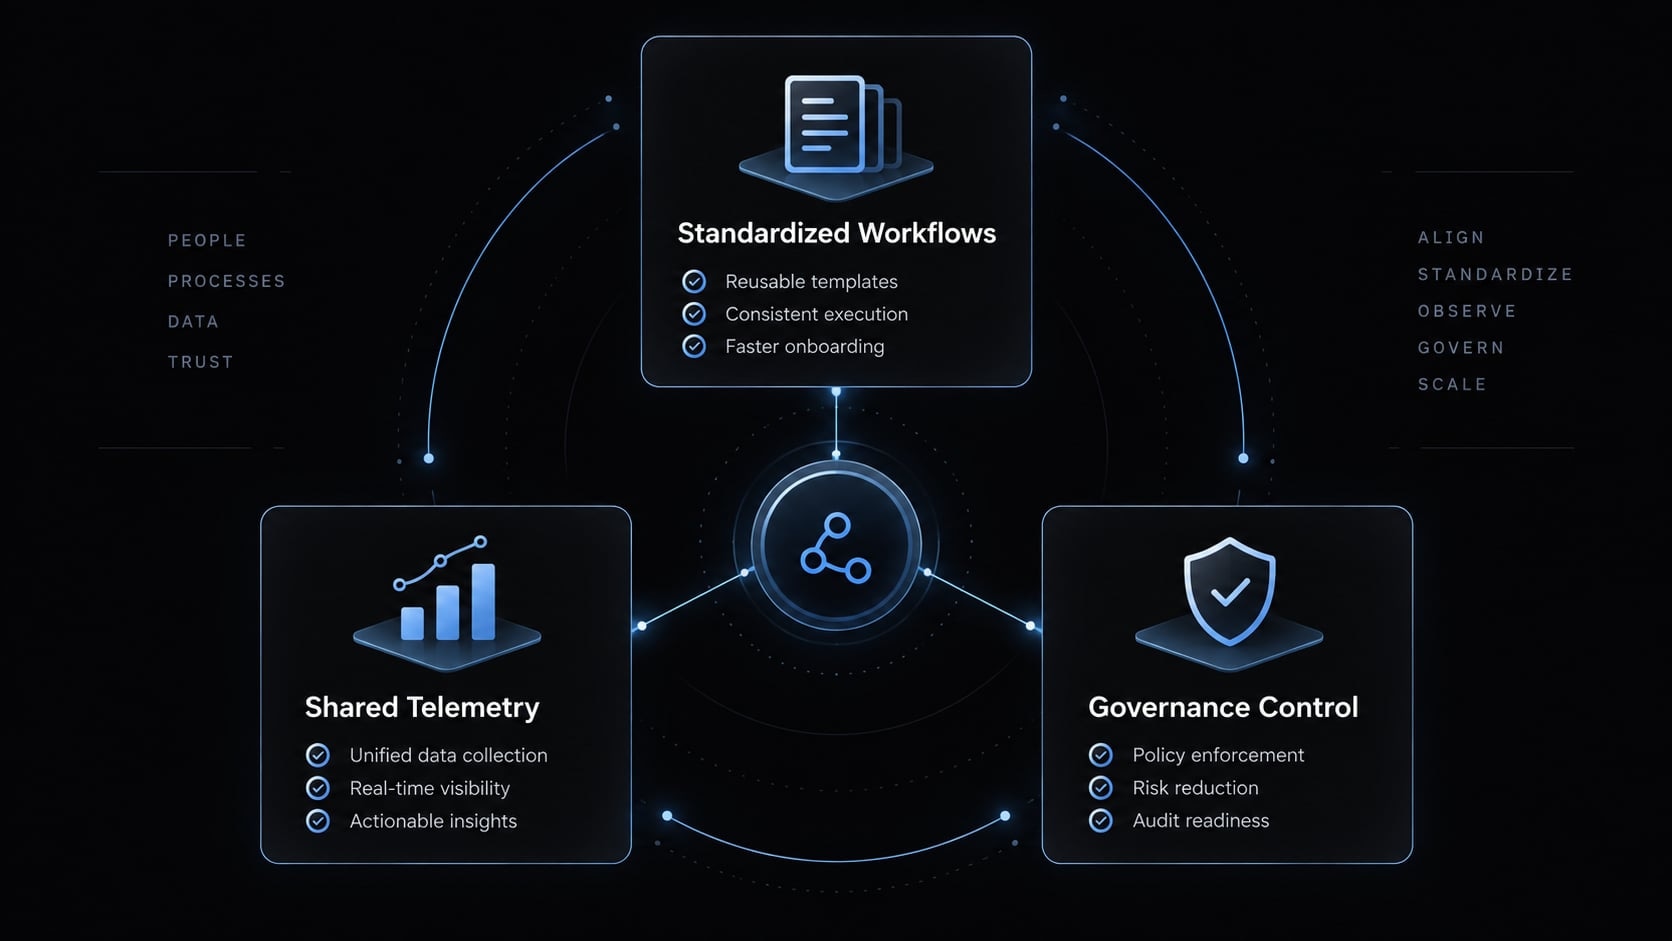
This is why repeatability matters. A stable AI workflow should include reusable configuration, consistent OTLP outputs where needed, and clear governance boundaries. Standardized, reusable workflows reduce the need to rebuild hooks, configs, and telemetry handling for every team or repository.
Operationally, this is the class of problem platforms like AgentKit help reduce: Not by replacing observability tools, but by making agent setups more repeatable across teams that need shared control, less drift, and more reliable workflow instrumentation.
Frequently asked questions
What is Claude Code observability?
Claude Code observability is the systematic process of collecting, tracing, and analyzing telemetry data-such as token usage, tool invocations, and session logs-generated by your AI coding agent. It transforms raw usage logs into queryable, actionable data, allowing teams to monitor costs, debug agent workflows, and ensure governance compliance.
What should teams track first in Claude Code?
To avoid over-engineering, teams should prioritize metrics that inform immediate business and engineering decisions:
- Session counts and active users.
- Token consumption and total cost by team or project.
- Tool call frequency and step timing.
- Prompt and output trace history.
- Approval and redaction logs for governance compliance.
Which Claude Code observability setup is best for my team?
The right setup depends on your infrastructure maturity:
- Solo developers: Lightweight local hooks.
- Small teams: Self-hosted tracing (e.g., Langfuse).
- Engineering teams: OTLP export to existing stacks (e.g., CloudWatch, Grafana).
- Enterprise orgs: Managed telemetry pipelines (e.g., Bindplane) for redaction and multi-destination routing.
How do I implement Claude Code observability without overbuilding?
Follow a phased rollout:
- Start with one core goal, such as cost control.
- Implement only the telemetry required to answer that specific question.
- Validate signal quality before expanding to complex traces.
- Introduce advanced governance and redaction controls only once usage patterns are stable and identified as high-risk.
Is logging the same as observability?
No. Logging simply stores raw data in files, which often becomes "dark data" that is hard to query. Observability uses structured instrumentation-such as OpenTelemetry-to make that data searchable, comparable, and attributable across different users, projects, and timeframes.
When should teams implement governance controls for Claude Code?
Governance controls, such as automatic approvals, payload redaction, and strict retention policies, should be added when your team moves from experimental use to production-grade delivery. Implementing these too early adds unnecessary operational overhead, while ignoring them at scale creates significant security and compliance risks.
Read more:
- Claude Code invalid tool parameters: Causes and fixes
- Claude Code Figma MCP setup: Remote vs desktop guide
- How to authenticate Claude Code in terminal
Conclusion
Claude Code observability is not about collecting more data for its own sake. The practical path is to start with usage and cost visibility, expand into traces and tool activity when workflow questions appear, and add governance controls only when maturity and risk justify them. That sequence gives teams a way to build measurable, reviewable, governable AI coding workflows without turning observability into an oversized infrastructure project.
If your current challenge is repeatability rather than raw telemetry, review a starter workflow blueprint or observability checklist before adding more tooling.