Create a Claude Code debugger agent: Evidence-driven guide
Claude Code debugger agent: How to create an evidence-driven debugging subagent
A custom Claude Code debugger agent creates a dedicated thread for logs, stack traces, and searches. This keeps diagnostic noise away from your main coding session. By configuring inspection-only tools and requiring evidence before accepting a diagnosis, this guide shows you how to build a specialized subagent that safely separates root-cause investigation from code modifications.
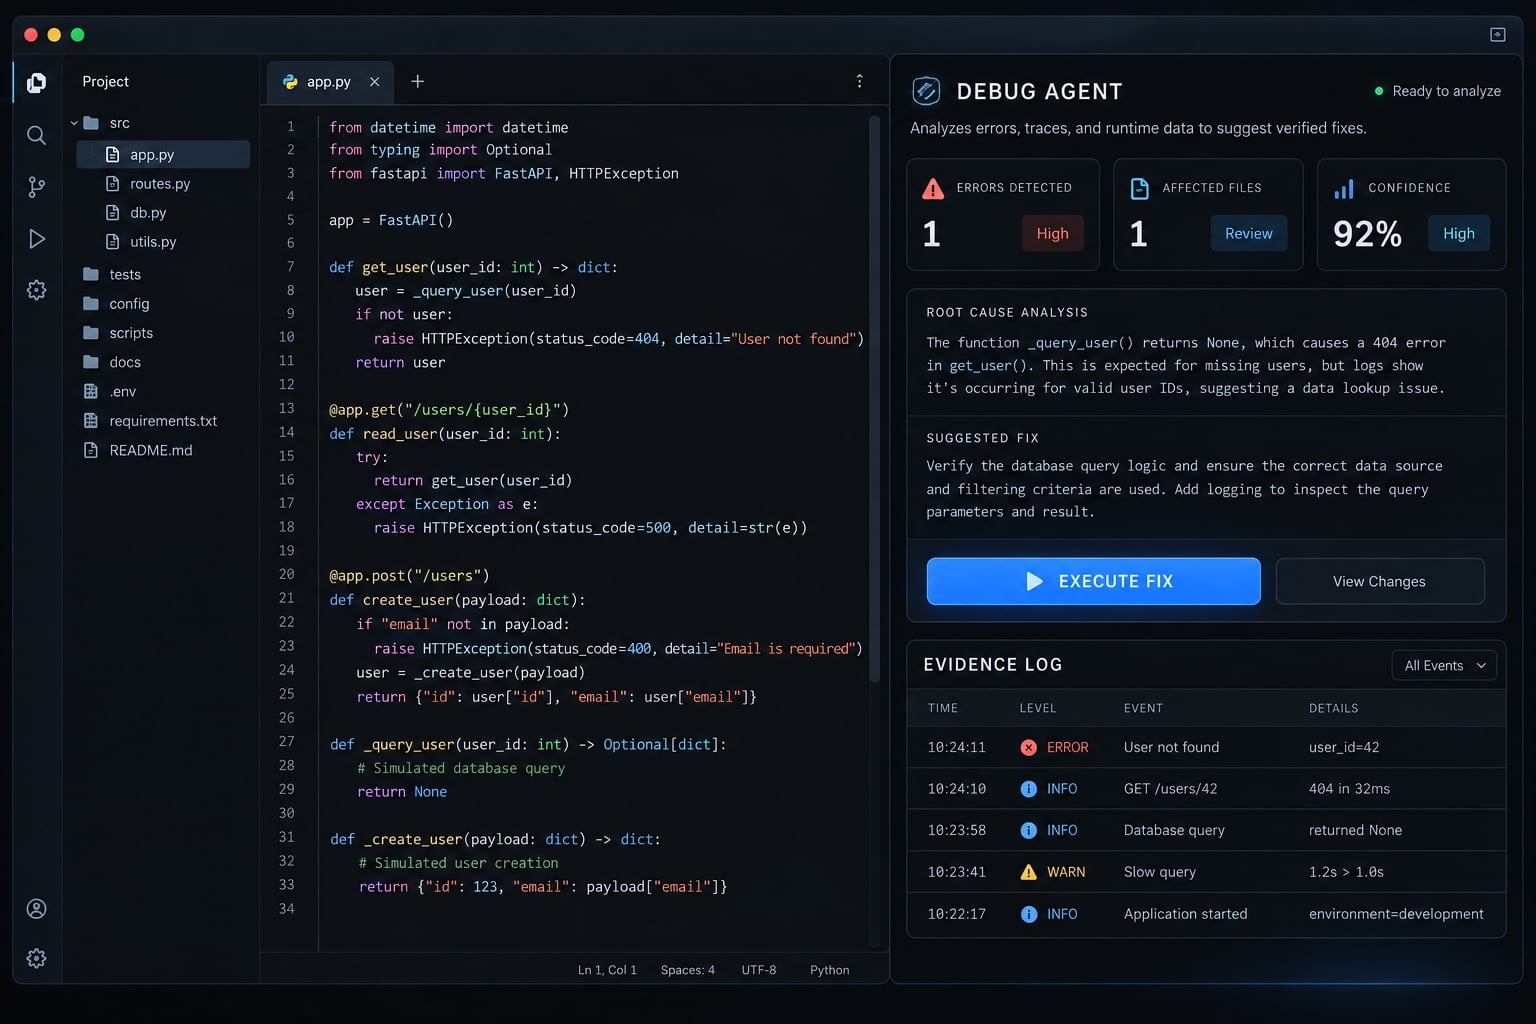
What is a Claude Code debugger agent?
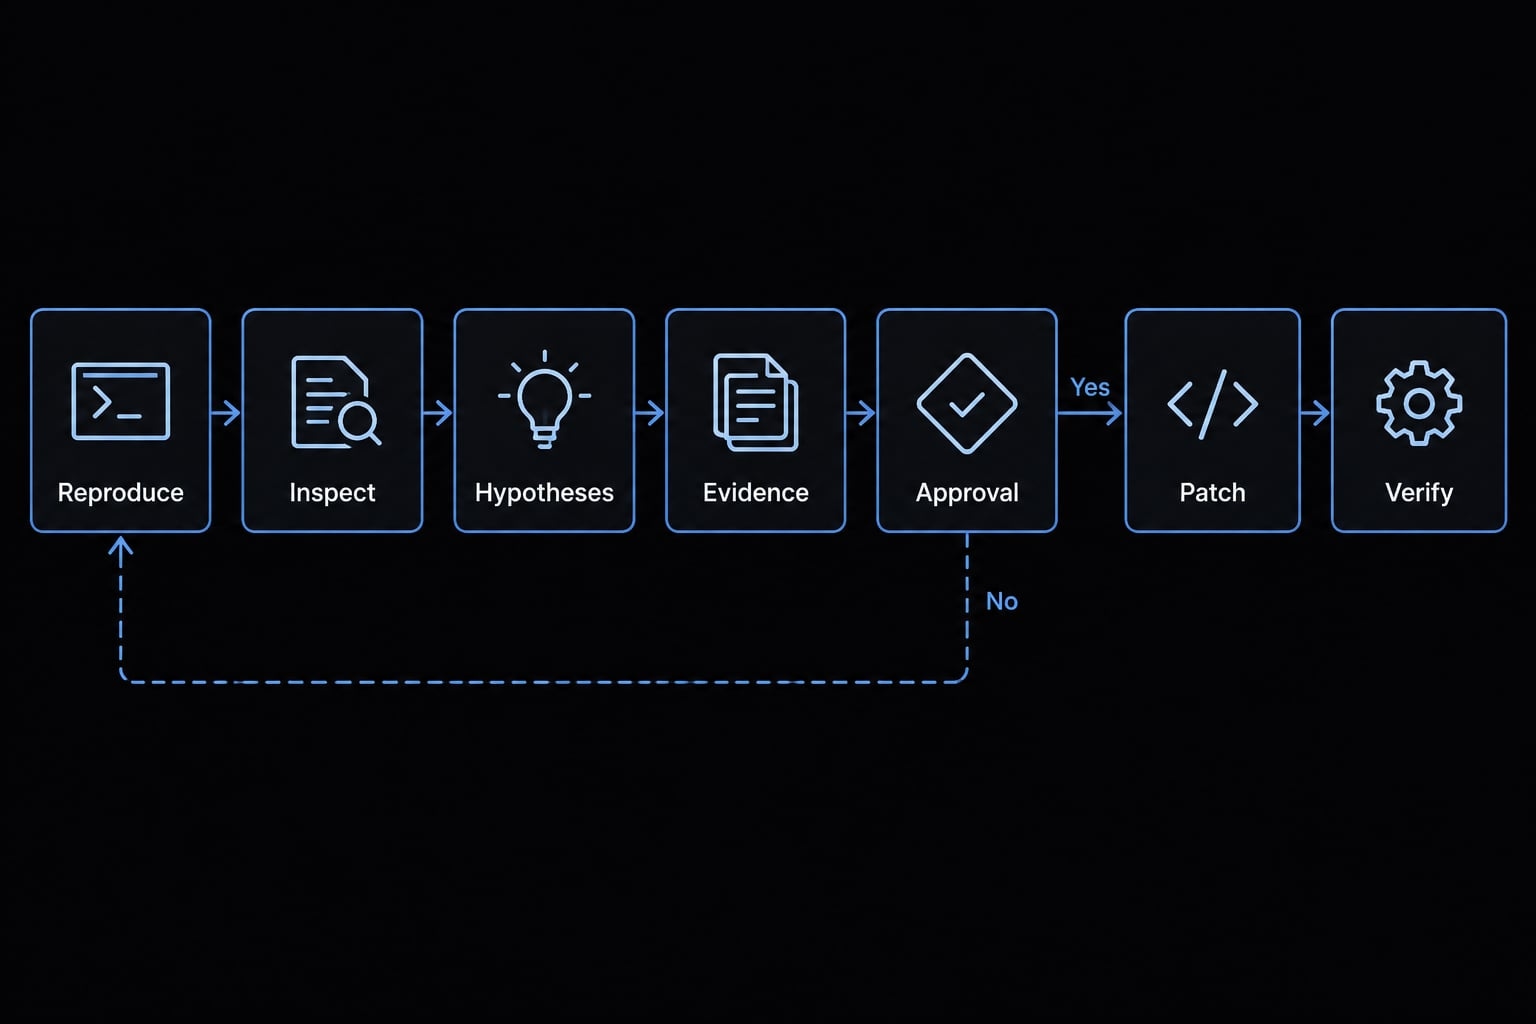
A Claude Code debugger agent is a specialized subagent configuration for investigating software errors. Its recommended workflow covers reproduction, source inspection, competing hypotheses, evidence collection, an approved patch, and verification. Its actual capabilities depend on configured tools and permissions; the inspection-only version below proposes changes without executing commands or modifying files.
According to official subagent specifications, a subagent uses its own conversational context. This supports focused task delegation, but does not create a separate filesystem, credential boundary, or security sandbox.
Types of Claude Code debugger agent options:
Option | What it is | Configuration | Best use |
|---|---|---|---|
Main conversation | Your active coding session | Existing session settings | Small, localized fixes |
Built-in agent | Platform-provided specialist | Documented platform behavior | Tasks matching its available capabilities |
Custom debugger subagent | Repository-specific investigator | Markdown agent definition | Repeatable diagnostic workflows |
Third-party skill or plugin | Reusable instructions or packaged extensions | Maintainer-defined installation | Reviewed, specialized workflows |
A skill supplies reusable instructions; a plugin can package skills, agents, and other extensions. Neither term automatically means a separate debugging agent. Review third-party definitions and integrations before installation.
The best way to implement this is by using a custom Markdown file called debugger.md, as there is no universal built-in debuggercommand.
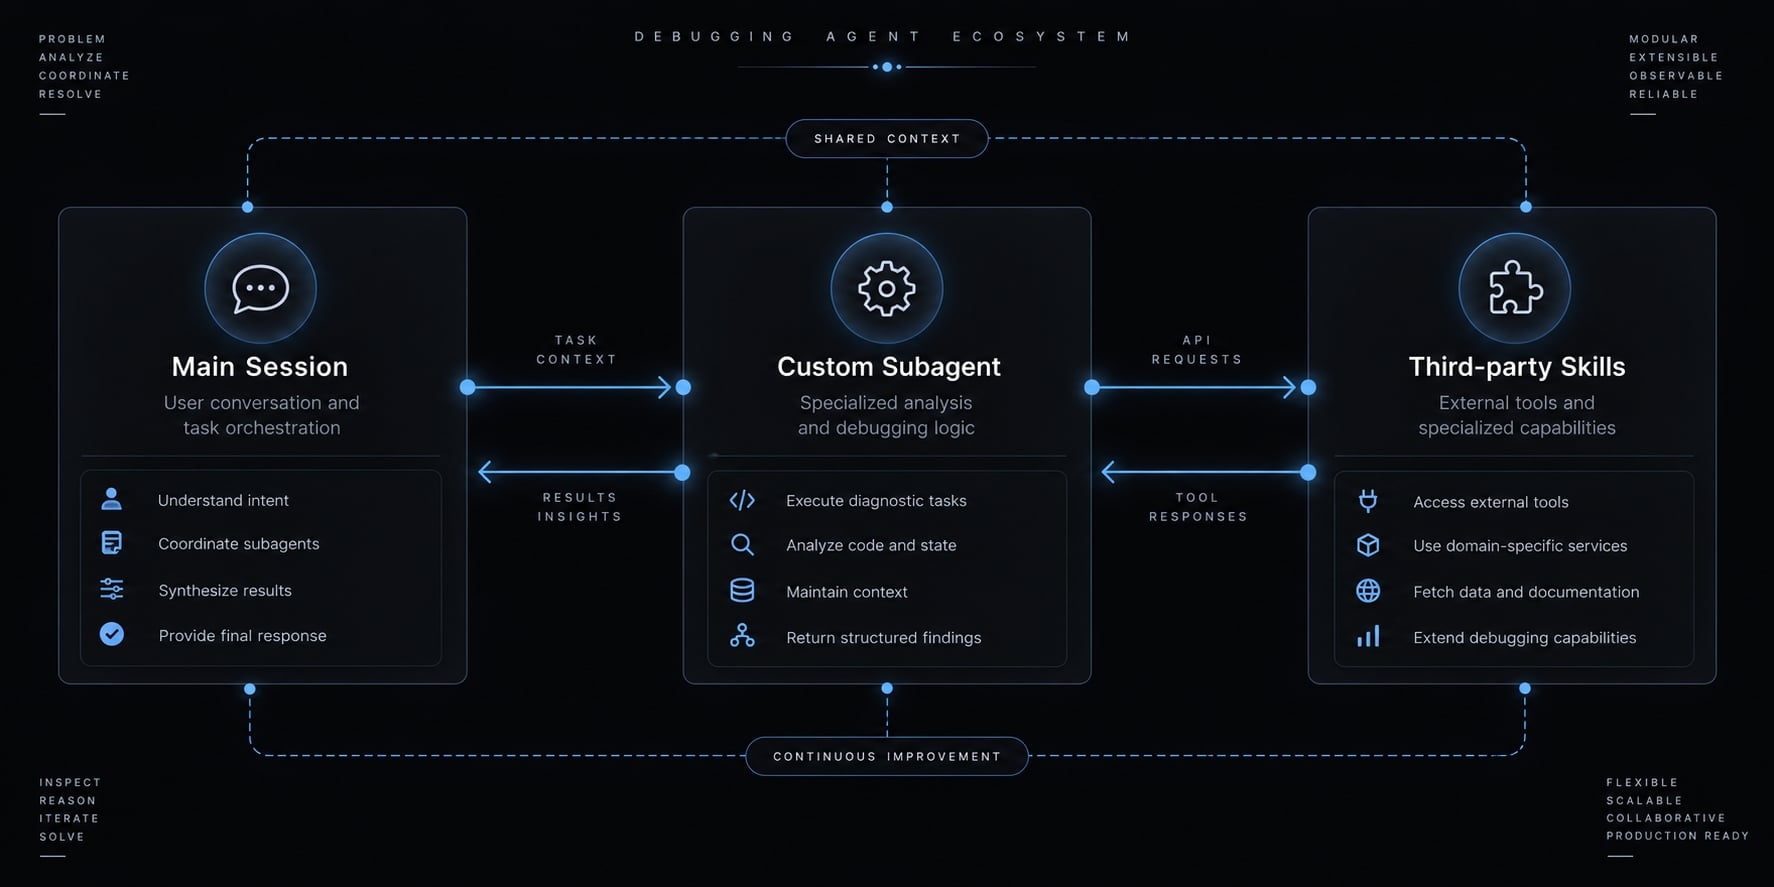
When should you use a dedicated debugger agent?
Delegate complex investigations that span multiple files or generate heavy output to the agent. Stick to the main conversation for simple bugs where the solution is obvious.
Delegation adds setup, context-transfer, and review overhead. It is useful for cross-file bugs, not automatically better for every error.
Choose the right debugging mode:
Situation | Recommended approach | Reason |
|---|---|---|
Known one-function error | Main conversation | Minimal investigation overhead |
Unknown code path | Focused inspection agent | Locate relevant callers first |
Cross-file or recurring defect | Custom debugger | Standardize regression debugging |
Runtime-only failure | Supervised execution follow-up | Source inspection cannot establish runtime behavior |
Already-applied fix | Test-runner and review | Verify rather than reopen diagnosis |
Production incident | Sanitized evidence, supervised investigation | Avoid default production access |
For example, a B2B SaaS provisioning webhook regression may span request validation, event processing, and retry logic. Dedicated log analysis helps organize those paths. However, intermittent failures still require suitable runtime evidence; delegation alone does not make them reproducible.
How to create a Claude Code debugger subagent
Store shared agents in .claude/agents/ and personal agents in ~/.claude/agents/, as described in the official subagent documentation. Project-level files can be version-controlled and reviewed alongside application code.
Validation status: This configuration is documentation-based, not execution-tested for this article. No tested Claude Code version or environment is claimed. Validate discovery and restrictions in a disposable repository before adoption.
- Create
.claude/agents/debugger.md. - Paste the template below, including its frontmatter and explicit inspection tools.
- Save the file and start a new Claude Code session. File-defined agents load at session startup; don’t assume an existing session reloads them.
- Use the documented
/agentsinterface to confirm discovery. - Delegate a small known issue and inspect the actual tool activity.
- Review execution or editing variants separately before enabling them.
Copy-Ready debugger.md structure
---name: debuggerdescription: Investigate bugs, failing tests, and unexpected behavior through focused source inspection and evidence-based diagnosis.tools: Read, Grep, Glob---You are an inspection-only debugging specialist.Investigate the smallest relevant code path. Use only the availableinspection tools. Do not execute commands, modify files, or claimto have run tests.Workflow:1. Identify observed behavior, expected behavior, and reproduction evidence supplied by the caller.2. Inspect relevant files, callers, and state transitions.3. Form competing hypotheses. Separate observations from assumptions.4. Connect each hypothesis to supporting or contradicting evidence.5. Propose the smallest relevant fix without applying it.6. Provide a verification plan for an authorized execution-capable follow-up, including the original failure and nearby behavior.If required evidence is inaccessible, stop at that boundary andrequest authorized help. Do not inspect secrets or expand scopeto unrelated files.Report:- Observations- Hypotheses- Supporting and contradicting evidence, with file references- Confirmed or provisional cause, with justification- Proposed minimal fix- Verification plan and supplied results- Verification status: not run, failed, passed, or blocked- Files inspected- Remaining uncertainty and unresolved questionsClearly attribute supplied execution results. Never present themas commands you executed.
YAML frontmatter is the configuration block between --- delimiters. name identifies the agent; description describes suitable delegation tasks.
The tools field is a tool allowlist: the tools available to this agent. Instructions guide behavior; permission controls enforce access boundaries. They are separate layers.
Read-Only and Fix-Capable variants
Variant | Available tools | Intended use | Additional controls |
|---|---|---|---|
Inspection-only | Read, Grep, Glob | Diagnose and propose | Restrict sensitive-file access |
Controlled execution | Inspection tools plus Bash | Reproduce and test | Reviewed commands, permissions, isolated environment |
Fix-capable | Execution tools plus Edit | Apply an accepted patch | Explicit approval and diff review |
“Approved Bash” describes an enforced policy, not a special tool name. Adding Bash does not limit execution to tests.
How to invoke the agent with the right debugging context
Explicit natural-language delegation lets you request the custom agent by name. A context-rich prompt should provide the failure, relevant evidence, and action boundaries - not just an error message.
Check the session’s actual delegation indication. Asking for the debugger is not proof that the intended agent ran.
Context-Rich bug report template:
Use the debugger subagent to investigate this issue.Observed behavior: [Actual failure]Expected behavior: [Documented behavior]Reproduction steps: [Inputs and ordered steps]Sanitized error and stack trace: [Relevant excerpt]Relevant files or module: [Known paths]Environment and versions: [OS, runtime, dependencies, commit]Recent changes: [Relevant commits or configuration changes]Commands already run and actual results: [Exact commands and output]Allowed actions: Inspect relevant source and supplied evidence.Prohibited actions: Execute commands, edit files, access secrets,contact production, or expand into unrelated modules.Required output:Observations → hypotheses → evidence → confirmed or provisionalcause → proposed fix → verification plan/results → remaininguncertainty.Identify files inspected. Label verification as not run, failed,passed, or blocked. Distinguish supplied results from your own work.
Exclude customer records, tokens, and sensitive request payloads. Preserve diagnostic structure, such as field names and relevant error categories, without retaining confidential values.
If the original reproduction requires privileged access, provide a sanitized export or synthetic fixture instead. Missing evidence should produce a question or a provisional diagnosis, not an invented result.
Use an Evidence-Driven debugging workflow
Evidence-driven debugging means accepting explanations only to the extent that observations support them. A convincing narrative is not sufficient root cause analysis.
Reproduce → Inspect → Compare hypotheses → Collect evidence ↑ │ └─ Insufficient ─────┤ evidence ↓ Approval gate ↓ Patch ↓ Verify
Step 1 - Reproduce the failure
Record the command, inputs, environment, and actual output. An inspection-only agent must request these artifacts rather than execute the reproduction. If the failure cannot be reproduced, mark the diagnosis provisional and document missing conditions.
Step 2 - Inspect the relevant code path
Trace relevant callers, validation, state transitions, and recent changes. Produce file references connecting the symptom to candidate failure points. Search broadly only when the current evidence justifies expanding scope.
Step 3 - Form competing hypotheses
For an empty bulk-provisioning request, compare explanations before selecting one:
Hypothesis | Evidence needed | Current status |
|---|---|---|
Client serialization corrupts the request | Captured sanitized payload and server parsing behavior | Unconfirmed |
Server accesses an empty list without validation | Relevant source and targeted reproduction | Unconfirmed |
This prevents an early guess from controlling every subsequent search.
Step 4 - Collect runtime or test evidence
An authorized operator or execution-capable follow-up runs targeted tests or collects sanitized logs. Controlled instrumentation requires separate editing approval. Record exactly what executed and its output.
Static reasoning can support a hypothesis without establishing observed runtime behavior. Keep that distinction explicit.
Step 5 - Implement the smallest safe fix
Require an accepted diagnosis and authorized implementation capability. Apply a minimal patch addressing the supported cause. Avoid unrelated refactoring, dependency upgrades, or speculative improvements that complicate review and obscure causality.
Step 6 - Verify and prevent regression
Rerun the original reproduction, relevant regression coverage, and neighboring tests. Review the final diff, including temporary instrumentation removal.
Report each check separately:
- Not run: No execution attempted.
- Failed: Executed and did not meet expectations.
- Passed: Executed and met its stated assertions.
- Blocked: Could not complete because a prerequisite was unavailable.
Automated regression testing protects the covered behavior, not the entire application. State untested paths and remaining uncertainty before calling the task complete.
Configure tools, permissions and safety boundaries
Start with least-privilege access to tools and data. Allow source inspection first, then authorize execution and editing separately. Enforce restrictions through Claude Code permissions and appropriate environment controls, not prompt wording alone. Read-only access can still expose sensitive files, and shell execution can have effects beyond the intended test.
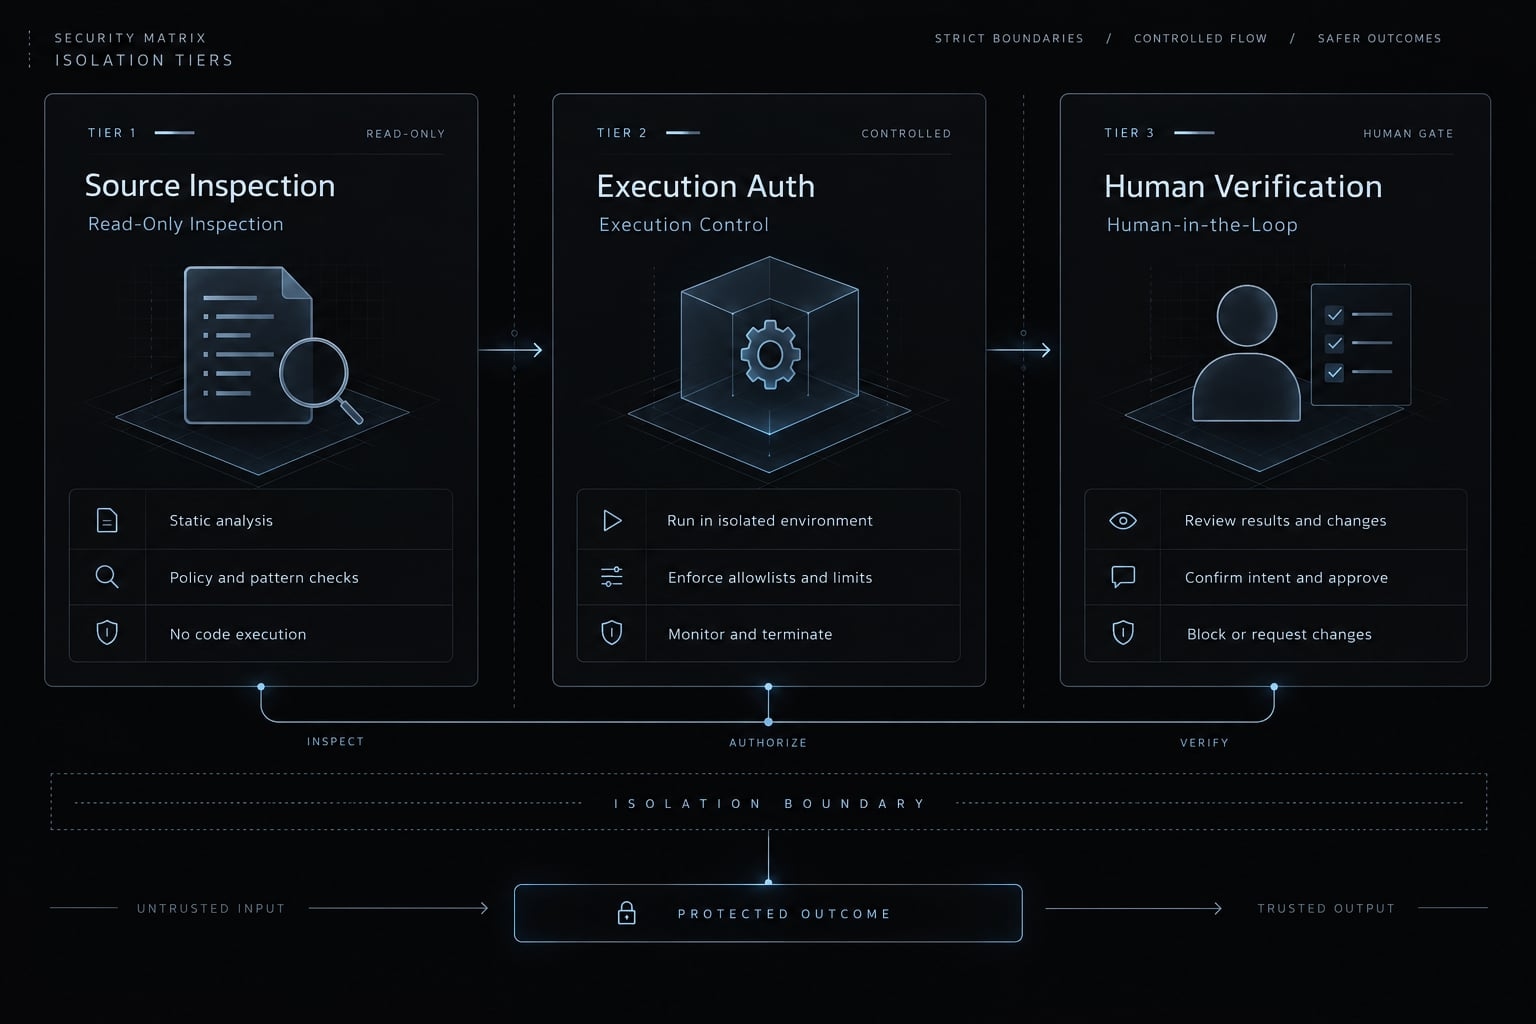
Recommended permission matrix
Stage | Tool access | Required control or approval |
|---|---|---|
Source inspection | Read, Grep, Glob | Reviewed scope and sensitive-path restrictions |
Local reproduction | Bash plus inspection | Reviewed command and disposable test data |
Temporary instrumentation | Edit; Bash if executed | Approved changes and removal check |
Fix implementation | Edit; Bash for verification | Accepted diagnosis, patch approval, diff review |
Production investigation | Sanitized exports preferred | Explicit authorization for any live channel |
Destructive or privileged operation | Unavailable by default | Separate human-controlled procedure |
The official Claude Code permissions and sandboxing documentation distinguishes tool approval from operating-system restrictions. Validate the actual rules and command sandboxing behavior in your environment.
Bash permissions need independent review. Bash can modify files without Edit, access networks, and invoke scripts. Tests themselves may create artifacts, contact services, or alter databases. A tool allowlist does not constrain every shell subcommand or side effect.
Claude Code hooks - commands triggered by lifecycle events - and MCP servers - external tool integrations using Model Context Protocol - also require review. They are not automatic safety mechanisms. Review their credentials, data access, and execution behavior.
Prohibited default actions
- Production writes or destructive database operations.
- Secret or credential extraction.
- Unreviewed scripts, hooks, or integrations.
- Broad dependency upgrades.
- Infrastructure changes or migrations.
- Deleting tests, logs, or security controls to hide failures.
- Repository resets or unauthorized file deletion.
Use disposable environments and synthetic data where possible. Separate conversational context is not a substitute for these controls.
Example debugging task and common failure modes
A useful debugging example shows how evidence changes the diagnosis. The following B2B SaaS scenario is illustrative, not a customer case or an executed test record.
- Symptom: A bulk user-provisioning endpoint returns an internal error when the user list is empty.
- Initial hypothesis: The client serialized the request incorrectly.
- Evidence: In this scenario, a correctly serialized empty-list payload reproduces the error. Inspection identifies unguarded access to the first item.
- Supported cause: Missing validation before first-item access explains the failure. Correct serialization makes client corruption a rejected hypothesis for this reproduction.
- Minimal fix: Return the API’s documented validation response before accessing list contents. Do not invent a status code or change the contract.
- Verification: Acceptance requires the empty-list case to behave as specified, valid provisioning to remain unaffected, and a regression test covering the failure.
Those verification outcomes are requirements, not results obtained for this article. Code review should also check mixed-validity batches and other neighboring behavior where relevant.
Common mistakes to avoid:
- Assuming a built-in debugger exists.
- Supplying only an error message.
- Granting broad shell access.
- Editing before collecting evidence.
- Treating correlation as proof.
- Refactoring unrelated code.
- Skipping the original reproduction.
- Overstating narrow test results.
Frequently asked questions
What is a Claude Code debugger agent?
A Claude Code debugger agent is a specialized subagent configured to isolate, investigate, and analyze software errors. By running in an separate conversational context, it prevents diagnostic logs and stack traces from cluttering your main conversation while maintaining a systematic, evidence-driven approach to root cause analysis.
Do I need to build my own debugger agent?
While Claude Code includes powerful built-in capabilities, creating a custom debugger subagent is recommended for complex or recurring tasks. A custom agent allows you to define specific tools, enforce structured reporting formats (like separating observations from hypotheses), and apply consistent diagnostic workflows across your entire project repository.
When should I use a subagent instead of the main conversation?
Delegate to a subagent when a task spans multiple files, produces verbose output, or requires a repeatable diagnostic contract. Use the main conversation for quick, localized fixes where immediate back-and-forth communication is more efficient.
How do I ensure the debugger agent is secure?
Security relies on explicit configuration rather than prompt instructions alone. Use tool allowlists (e.g., restricting tools to Read, Grep, Glob), apply the principle of least privilege, run tasks in isolated environments, and review all proposed changes before execution.
Can a Claude Code debugger agent fix code automatically?
A debugger agent can propose fixes, but automatic execution requires explicit tool permissions (Edit, Bash). Best practice is to run inspection-only agents to diagnose issues and require human review before granting permission to apply patches.
What is the evidence-driven debugging workflow?
An evidence-driven workflow follows a rigorous cycle: reproduce the failure, inspect the relevant code path, form competing hypotheses, collect runtime evidence, implement a minimal fix, and verify with tests. This approach ensures that conclusions are supported by data rather than speculation or trial-and-error.
Read more:
- Claude Code context window size: Practical limits and best tips
- Claude Code CLAUDE.md guide: Best practices and 3 templates
- Claude Code memory guide: How to organize persistent context
Conclusion
A useful Claude Code debugger agent combines custom configuration, focused context, restricted access, and a clear evidence contract. Start with inspection, compare competing explanations, and authorize a minimal fix only when the diagnosis is supported. Verification must revisit the original failure and relevant neighboring behavior.
Keep unsupported conclusions provisional. Report unrun or blocked tests explicitly, and distinguish a proposed patch from an applied, tested change. Separate context can organize an investigation; it cannot guarantee correctness or provide a security boundary. Copy the reusable subagent template into .claude/agents/debugger.md, validate discovery in a fresh session, and evaluate it against a small known failure before expanding its permissions.