How to calculate AI coding tools ROI: Framework & expert guide
AI coding tools ROI: How to calculate costs, productivity gains and business value
Determining AI coding tools ROI is not simply about measuring code generation speed, but proving whether realized business value truly justifies the total investment. Faster output can be offset by increased review times and unchanged release schedules. Consequently, engineering and finance leaders need a solid financial framework to accurately evaluate true productivity gains.
What AI coding tools ROI actually measures
AI coding tools ROI is the percentage return obtained by comparing recognized benefits from AI-assisted engineering with the full investment cost over the same period. Benefits may include validated capacity value, avoided expenditure, or attributable contribution margin, while incremental review, rework, operating costs, and quality risks constrain the result.
Period ROI = (Recognized benefits − investment cost) ÷ investment cost × 100
Use the same measurement period for both sides. A three-month pilot cannot legitimately combine three months of costs with twelve months of projected benefits.
Activity is not the same as business value
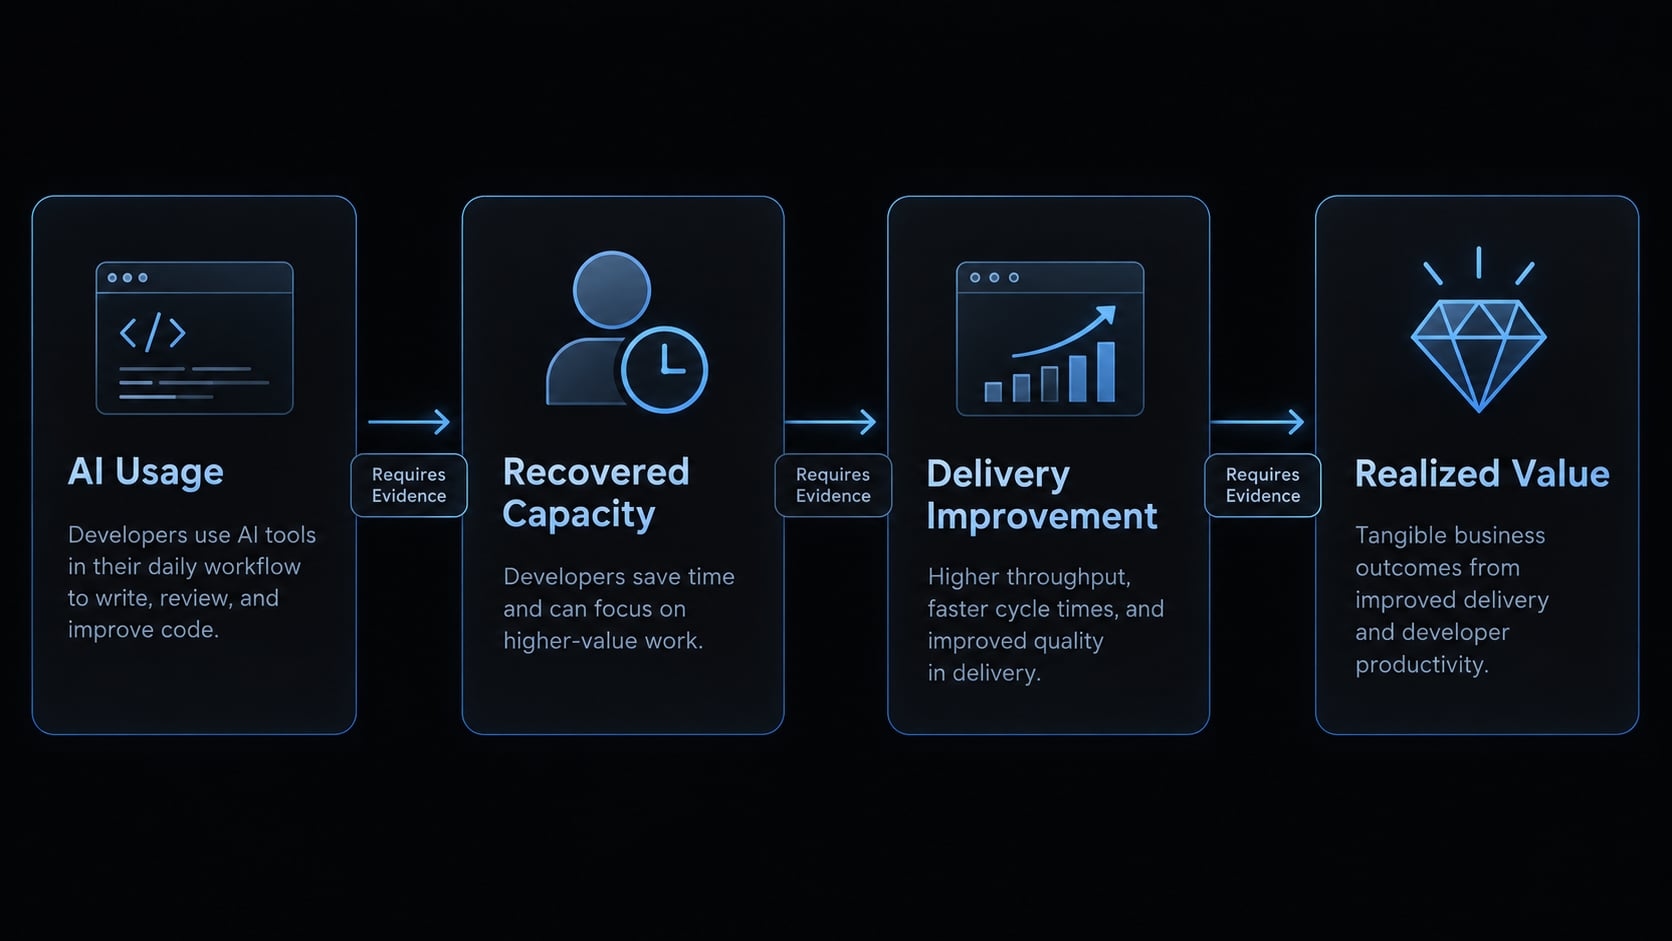
The value chain has four stages: AI usage → engineering capacity → delivery improvement → business value
For an enterprise SaaS team, generating tests faster may recover engineering time. Resolving a verified testing bottleneck may then accelerate an accepted release. Financial value depends on what that earlier release enables.
Usage metrics remain useful diagnostic indicators. They reveal inactive seats, workflow coverage, and adoption barriers. However, prompts, generated lines, and accepted suggestions do not establish return.
Why ROI must be quality-adjusted
A credible cost-benefit analysis subtracts incremental review, correction, prompting, and debugging from gross time savings. It also considers security remediation and code maintainability.
Here, quality-adjusted ROI describes an operational evaluation approach, not a standardized accounting metric. Quantifiable labor and incident effects enter the calculation where defensible. Independent security and reliability guardrails can still halt expansion, even when financial projections look promising.
Step 1 - Calculate the total cost of AI coding tools
Licenses are only one component of total cost of ownership. Separate initial investment from recurring operation, and assign every expense an evidence source.
With usage-based pricing, retries, long contexts, model choices, and tool activity can change consumption. Billing mechanisms differ; vendors do not necessarily charge separately for each activity.
AI coding tools total cost of ownership worksheet
Cost category | Include | Evidence/accounting treatment |
|---|---|---|
Direct tooling | Seats, subscriptions, usage, overages | Invoices; recurring |
Implementation | Setup, indexing, integrations | Labor records; one-time |
Enablement | Formal training and documentation | Participant hours; initial or recurring |
Administration | Access, licenses, monitoring | Owner hours; recurring |
Governance/security | Assessment, legal review, controls | Labor records and external spend |
Review/rework | Incremental review and correction | Captured in net-hours adjustment; do not add again |
Infrastructure | Continuous integration, sandboxes, hosting, storage | Platform bills; exclude duplicated charges |
Switching/overlap | Migration and duplicate subscriptions | Separate initial and recurring components |
Accounting rule: Formal onboarding belongs in investment cost. Task-level prompting and additional review belong in the net-hours adjustment. Ordinary review already included in the baseline is not an additional AI cost.
Inactive seats, duplicated subscriptions, and repeated configuration work are practical examples of the hidden costs of AI coding assistants. Include them in total cost of ownership rather than treating subscription invoices as the complete picture.
Calculate cost per active user and successful outcome
- Cost per active user = Period AI cost ÷ meaningfully active users during that period
- Cost per accepted outcome = Allocated workflow cost ÷ accepted completed outcomes
Define meaningful activity before measurement: For example, recurring use in an approved workflow, rather than opening the tool once.
An accepted outcome satisfies normal completion and quality criteria. An accepted suggestion does not necessarily qualify.
Specify the allocation boundary: Which licenses, usage, and shared operating costs belong to the workflow being evaluated.
In a hypothetical month, $3,000 of allocated cost across 20 active users equals $150 per active user, even if 30 users hold licenses. For outcome comparisons, compare similar test-generation tasks-not test tasks against incident investigations.
Step 2 - Measure adoption and net productivity impact
Paid seats, activation, and sustained AI adoption answer different questions. Measure whether eligible teams repeatedly use approved workflows and produce accepted outcomes.
Adoption and meaningful utilization metrics
Metric | Meaning | Limitation |
|---|---|---|
License utilization | Active users ÷ paid users | Depends on “active” definition |
Weekly active use | Users engaged each week | Activity is not value |
Retained use | Continued use across weeks | Can reflect mandates |
Workflow coverage | Eligible tasks using AI | Requires a task denominator |
Repository/use-case coverage | Where adoption occurs | Breadth can hide weak results |
Accepted outcome rate | Completed outputs meeting criteria | Does not establish financial benefit |
Use-case distribution | Usage split by task type | Task mixes change |
Choose denominators deliberately: Eligible users, paid users, and pilot participants are not interchangeable. Daily activity is not a universal requirement for meaningful adoption.
Calculate net hours saved
Net hours saved = Gross hours saved − incremental review − AI-related rework − prompting/debugging overhead
Hypothetical test-writing task:
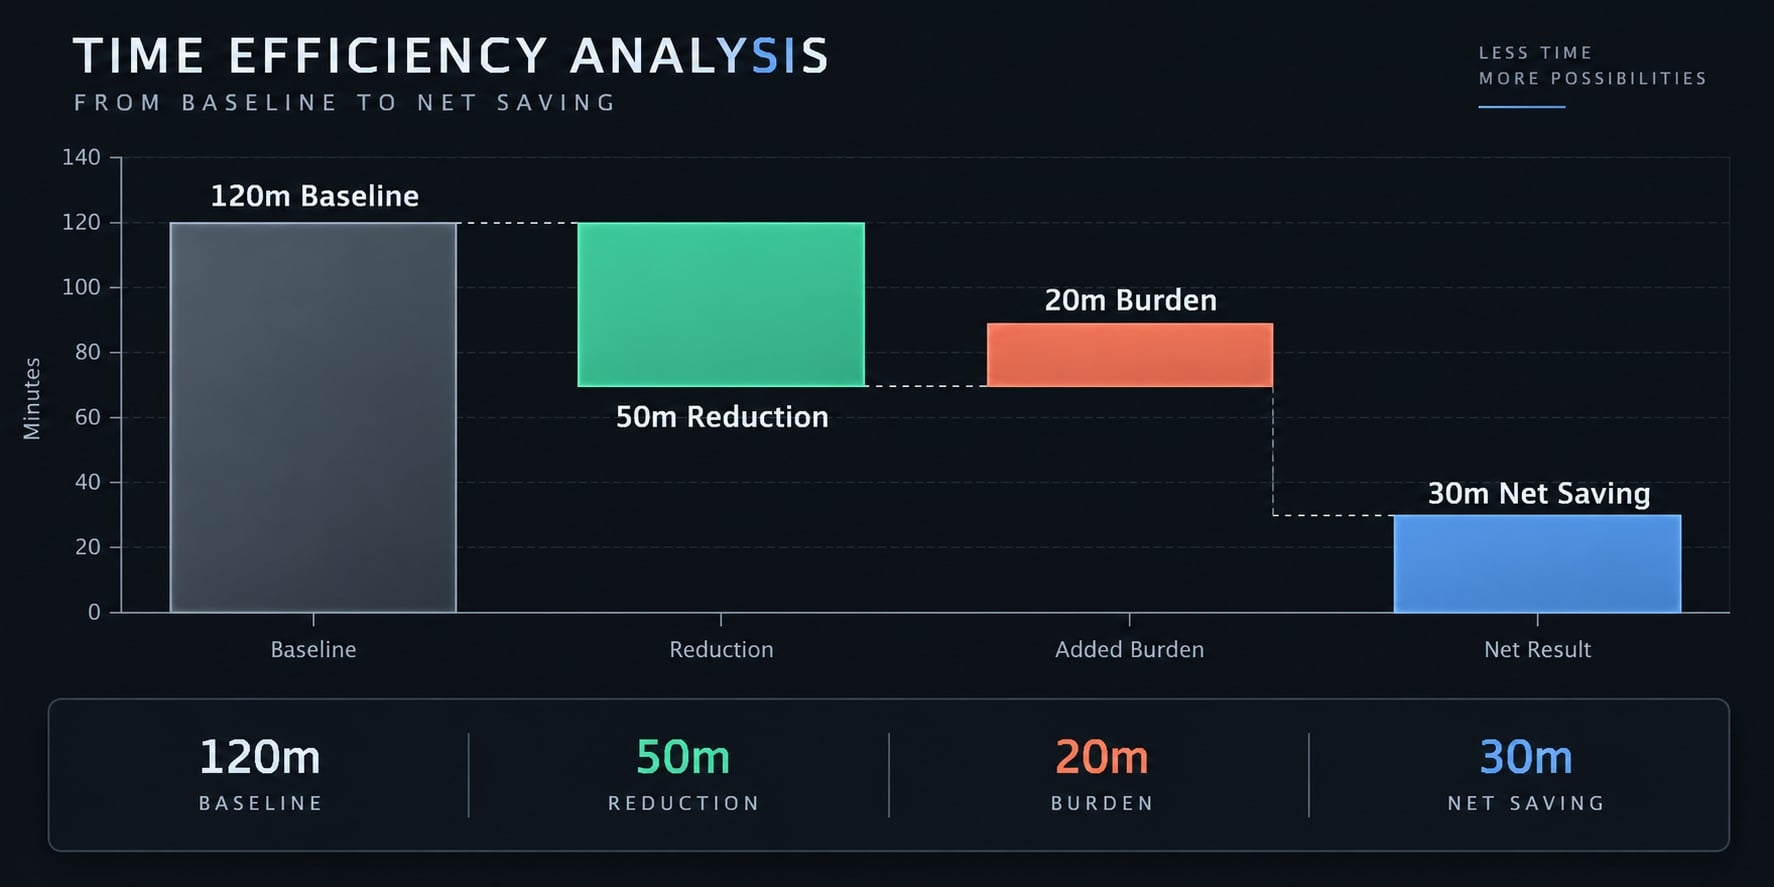
- Comparable baseline: 120 minutes, including ordinary review.
- AI-assisted execution: 70 minutes, including prompting and ordinary review.
- Additional correction and review: 20 minutes.
- Net saving: 120 − 70 − 20 = 30 minutes.
Prompting is already included in the 70 minutes. Do not subtract it again.
Validate self-reports using at least two evidence types, such as sampled task timing and pull request analytics. A pull request (PR) is a proposed code change submitted for review.
Elapsed PR time includes waiting; it is not equivalent to active labor time. If net hours are negative, report an operating burden. Do not use a low realization rate to discount away measured losses.
Measure by use case, not only by tool
Segment developer productivity across:
- Completion and repository exploration.
- Tests and documentation.
- Debugging and incident analysis.
- Refactoring, migration, review, and ticket-to-PR work.
Positive test-generation results do not establish positive returns for complex feature development. Compare engineering throughput within similar work categories.
Pair team-level measures with aggregated Developer Experience (DevEx)—developers’ experience of tools, feedback, and work conditions. Do not rank individuals by usage.
Step 3 - Validate productivity against delivery, quality and risk
Faster coding can move a bottleneck into review or deployment. Evaluate speed alongside quality, reliability, security, and developer experience before approving expansion.
Quality-adjusted engineering scorecard
Dimension | Metric | Positive signal | Warning signal |
|---|---|---|---|
Speed | PR cycle time | Comparable changes complete sooner | Review queues grow |
Throughput | Accepted comparable outcomes | More useful work completed | PR counts rise without delivery |
Review | Active review effort | Less effort, stable standards | More corrections or oversized changes |
Quality | Escaped defects and contextual rework | Stable or improving results | Defects or avoidable churn increase |
Reliability | Change failure rate and recovery | Stable deployment outcomes | More failures or slower recovery |
Security | Severity, coverage, unresolved findings | Consistent checks and timely fixes | Critical findings bypass controls |
DevEx | Aggregated friction and confidence | Lower burden, sustained confidence | Review fatigue or reduced trust |
Change failure rate measures the share of deployments requiring remedial intervention. This broader scorecard is not the DORA metrics. These frameworks guide measurement; none independently proves AI causality.
Interpret code churn contextually: Modification can mean healthy iteration or waste. Security finding counts depend partly on scan coverage. Code maintainability also requires review of complexity, duplication, testability, and future change effort.
Inner-loop gains vs. Outer-loop outcomes
- Inner-loop productivity concerns local activities such as understanding, writing, and testing code.
- Outer-loop outcomes concern review, integration, deployment, and reliable operation.
Faster test creation has limited delivery value if reviews remain blocked. Investigate where recovered time goes instead of assuming it shortens releases.
Set explicit gates: Unresolved critical security findings prevent expansion; reliability deterioration beyond an agreed tolerance triggers investigation. Small or noisy differences require more evidence.
Metrics that should not be used to rank individual developers
Do not rank developers by prompt volume, generated-code share, suggestion acceptance, or commit counts.
Individual scoring encourages metric gaming and undermines psychological safety. Use cohort-level evidence to improve workflows, not reward visible tool activity.
Step 4 - Convert engineering gains into realized financial value
Recovered time becomes financial value only through useful redeployment, attributable business outcomes, or changed expenditure. Unchanged payroll is not cash savings.
Apply a realization rate to net time savings
Realized productivity value is the finance-approved economic value of recovered capacity redeployed to useful work.
- Realized productivity value = Net hours saved × loaded hourly cost × realization rate
- Loaded hourly cost = Annual employment cost ÷ agreed annual working-hour basis
Finance should approve included employment costs and the working-hour denominator.
Support the realization rate with evidence. Unassigned spare capacity provides weak support. Completed priority backlog work provides stronger support. Reduced contractor demand or earlier completion of a constrained initiative may establish separately measurable benefits.
Engineering capacity planning should identify the destination of recovered hours before rollout. Do not prescribe a universal realization percentage.
Add quality, cost avoidance and time-to-market benefits
Benefit | Evidence required | Classification |
|---|---|---|
Productivity capacity | Net hours and useful redeployment | Economic value |
Avoided hiring | Documented hiring plan changed | Future expenditure avoided |
Contractor reduction | Reduced invoices or commitments | Expenditure reduced |
Defect reduction | Attributable remediation effort avoided | Capacity or cost benefit |
Incident reduction | Supported incident-cost comparison | Economic or cash benefit |
Earlier delivery | Demand evidence and attributable margin | Incremental contribution margin |
Maintenance reduction | Measured subsequent maintenance effort | Capacity or cost benefit |
Count each benefit once. Do not value the same hours as capacity, avoided hiring cost, and contractor reduction. Exclude remediation savings already reflected in net hours.
Do not add earlier-release margin and capacity value for the same work without a defensible allocation.
For finance review, prefer contribution margin—incremental revenue less associated variable costs—over gross revenue. State the attribution window and demand assumptions.
Calculate the final ROI and payback period
- Select supported, nonoverlapping benefits.
- Match investment costs to the same period.
- Calculate period ROI.
- Test realization, usage, and overhead assumptions.
- Calculate payback only when mathematically valid.
- Apply quality gates before deciding.
Simplified payback = One-time investment ÷ positive recurring net benefit per period
Recurring net benefit excludes already-counted one-time costs. Use this formula only when recurring benefits exceed recurring costs and remain reasonably stable. Otherwise report “no modeled payback under current assumptions.”
Worked example - Calculating AI coding tools ROI for a 50-developer team
Example Inputs
Input | Illustrative value |
|---|---|
Licensed developers | 50 |
Active utilization | 70% |
Active developers | 35 |
Measurement period | 3 months |
License and usage | $12,000 |
Implementation/integration | $10,000 |
Training/enablement | $8,000 |
Administration/governance | $5,000 |
Gross savings per active developer/month | 5 hours |
Incremental overhead per active developer/month | 2 hours |
Loaded hourly cost | $85 |
Expected realization | 50% |
Quality | No material observed change assumed |
The two-hour overhead includes all additional task-level review, correction, prompting, and debugging in this simplified model. Formal training remains in investment cost.
Example Calculation
- Gross savings:
35 × 5 × 3 = 525 hours - Incremental overhead:
35 × 2 × 3 = 210 hours - Net savings:
525 − 210 = 315 hours - Potential capacity value:
315 × $85 = $26,775 - Realized value:
$26,775 × 50% = $13,387.50 - Investment:
$12,000 + $10,000 + $8,000 + $5,000 = $35,000 - ROI:
($13,387.50 − $35,000) ÷ $35,000 × 100 = −61.75%
The model recovers 315 engineering hours, but recognizes only $13,387.50 in redeployed-capacity value, contingent on finance approval.
It establishes neither reduced cash expenditure nor incremental contribution margin. Those categories remain unclaimed.
This quality-adjusted benefit does not cover pilot investment. Time savings alone therefore do not justify expansion.
Scenario analysis
Keep measured hours and quality constant when changing realization.
Scenario | Realization | Recognized benefit | Pilot ROI |
|---|---|---|---|
Conservative | 25% | $6,693.75 | −80.88% |
Expected | 50% | $13,387.50 | −61.75% |
Optimistic | 75% | $20,081.25 | −42.63% |
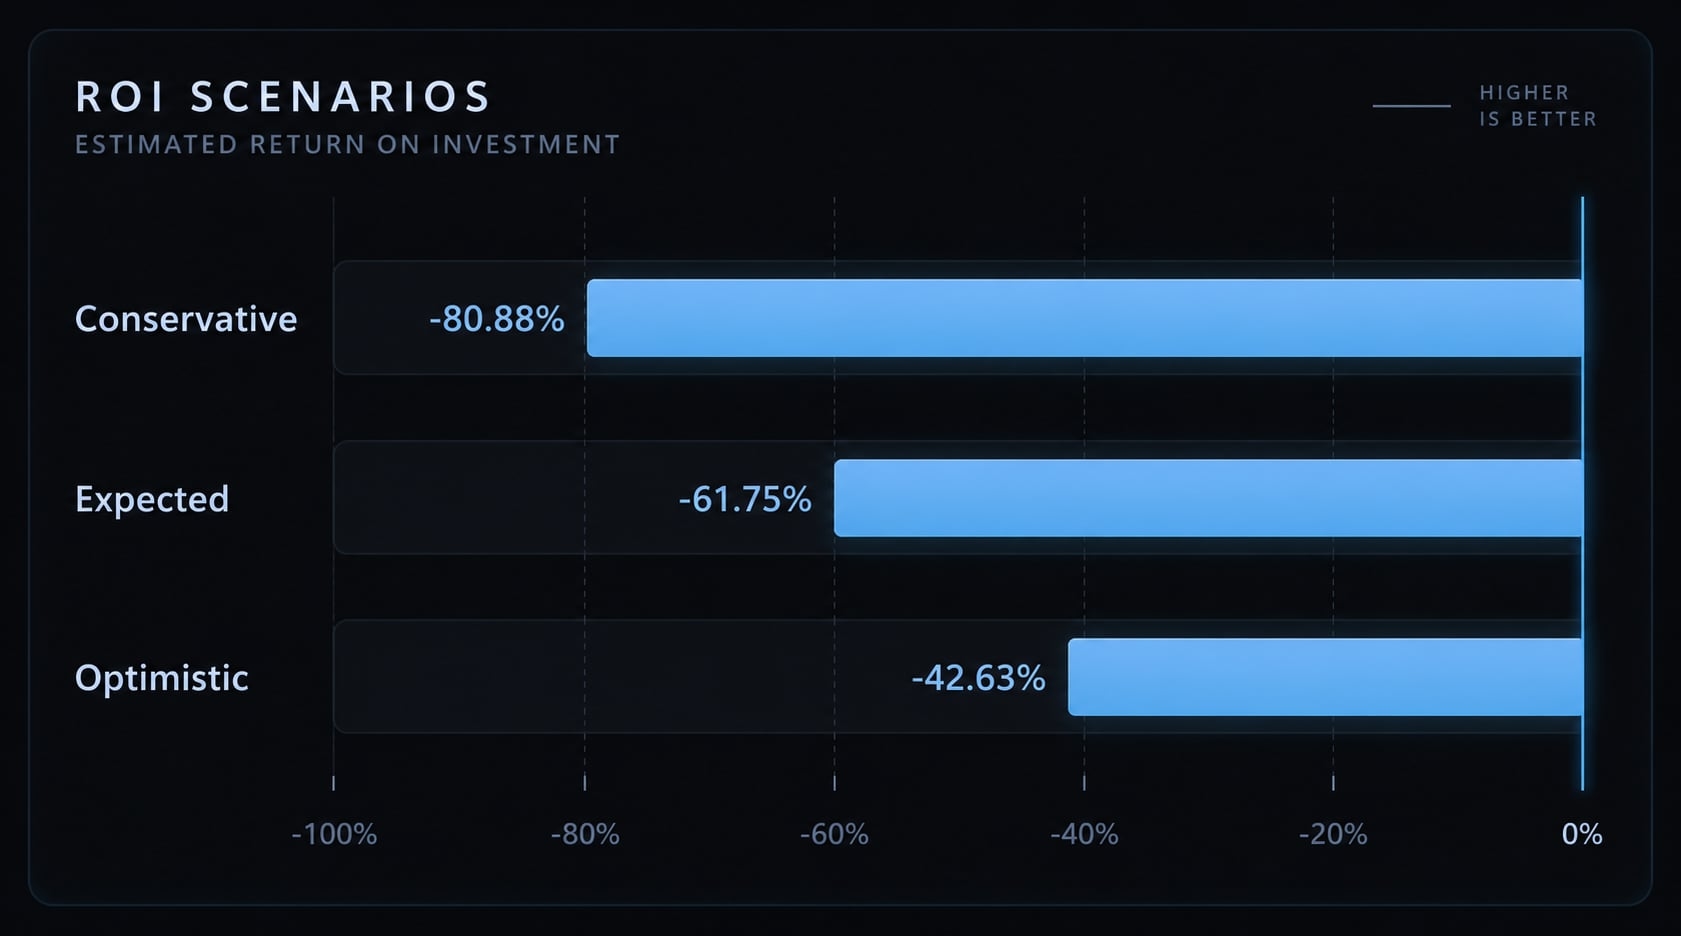
“Optimistic” does not mean investable. Even 100% realization would leave capacity value below the $35,000 pilot cost.
If implementation and initial training do not recur, next-quarter cost becomes $17,000. Expected benefits of $13,387.50 produce approximately −21.25% recurring-period ROI.
This is a conditional projection, not a forecast or annual return. Under expected assumptions, there is no modeled payback. Deteriorating quality requires separate overhead or incident-cost adjustments.
AI coding tool ROI decision matrix
Finding | Decision | Condition or next step |
|---|---|---|
Positive supported economics | Expand selectively | Stable quality and adequate evidence |
Low meaningful adoption | Optimize access and training | Diagnose barriers and inactive seats |
Savings erased by review | Redesign workflow | Reduce change size; retest net effort |
Usage costs dominate | Control consumption | Evaluate limits or routing where available |
Gains concentrated in one use case | Restrict scope | Expand only validated workflows |
Quality or security gate fails | Pause affected use | Remediate before reconsideration |
Persistent negative economics | Replace or stop | Allow reasonable training, evaluation, and diagnosis first |
Use these inputs and formulas as an AI productivity calculator worksheet. Keep AI coding assistant ROI separated into capacity value, actual expenditure effects, and attributable margin.
How to run a credible 30–90 day AI coding tool pilot
- Establish a comparable baseline.
- Select tools, cohorts, and approved workflows.
- Measure adoption and net effort.
- Validate delivery, quality, and risk.
- Calculate ROI and record the decision.
Pilot stage 1 - Establish the baseline
Use four to eight weeks of historical baseline engineering telemetry where practical. This can precede the intervention. Record staffing, work complexity, release conditions, and process changes. Weak baseline data lowers confidence.
Pilot stage 2 - Select tools, cohorts and use cases
Choose comparable teams, repositories, and task types. Use random assignment where practical; otherwise document matching limitations. Set data-access restrictions and approved uses. Keep the initial AI tool pilot focused rather than testing unrelated workflows simultaneously.
Pilot stage 3 - Measure adoption and net workflow impact
Track retained usage, accepted outcomes, and net labor effort. Validate survey estimates against workflow evidence. Separate formal onboarding from sustained use. Conduct cohort analysis—comparison of defined participant groups—by team and workflow.
Pilot stage 4 - Validate delivery, quality and risk
Check whether local savings reach review, deployment, and operations. Apply pre-agreed quality and security gates. AI governance means documented rules, ownership, and oversight for approved use. Rare incidents may require observation beyond 90 days.
Pilot stage 5 - Calculate ROI and make the decision
Assign accountable owners:
- Engineering: Workflow and delivery outcomes.
- Finance: Costs, valuation, and benefit overlap.
- Security: Risk thresholds and exceptions.
- Sponsor: Final investment decision.
Agree thresholds before seeing results. Cover recurring economics, retained adoption, review effort, defects, and policy compliance without assuming universal benchmarks.
Common AI ROI measurement mistakes
- Treating code volume as value.
- Treating suggestion acceptance as delivery.
- Applying 100% realization to survey estimates.
- Omitting training and operating costs.
- Double-counting capacity and expenditure benefits.
- Comparing unmatched teams or tasks.
- Using individual surveillance instead of workflow analysis.
- Annualizing short-term results without support.
Build the pilot scorecard around owners, baseline dates, restrictions, metrics, gates, costs, confounding changes, confidence limitations, the decision rationale, and a follow-up date.
Improving ROI through standardized agent workflows
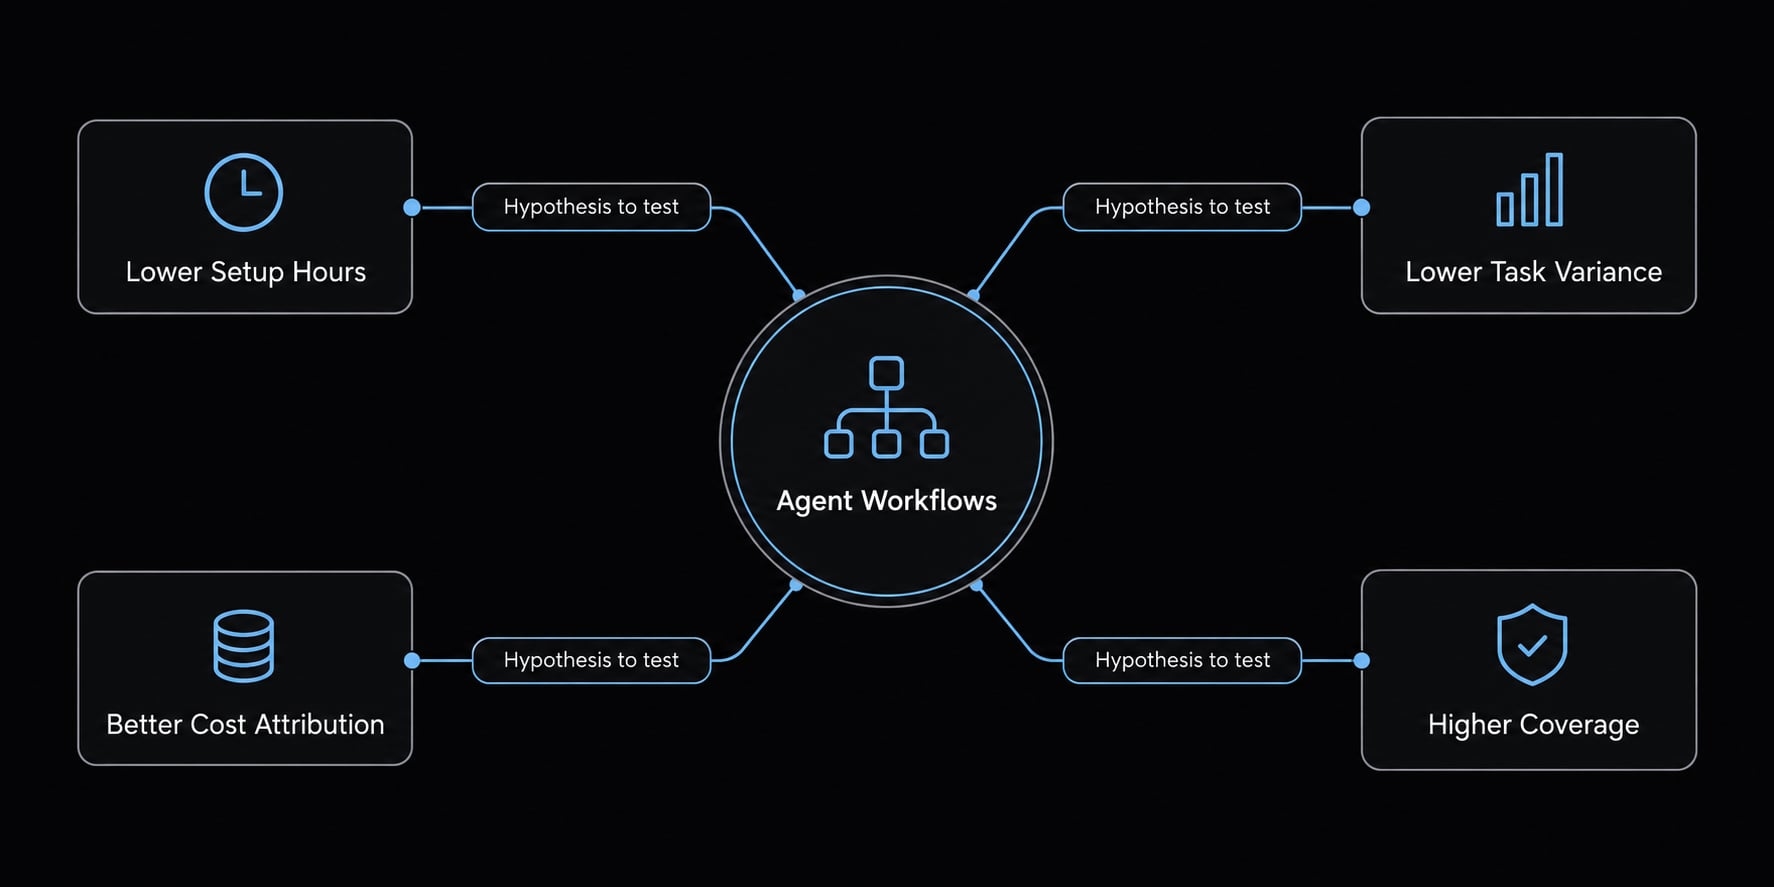
Standardized agent workflows may reduce repeated setup and inconsistent execution. They are an operational intervention—not evidence of return by themselves.
AgentKit publishes this guide and has a commercial interest in workflow tooling. Its product scope includes agent kits, specialized subagents, reusable skills, integrations, and management interfaces. Validate current capabilities against your environment before assigning financial value.
AgentKit capability-to-ROI mapping
Problem | Capability to verify | Measurement hypothesis | Evidence |
|---|---|---|---|
Repeated setup | Agent kits and reusable skills | Lower setup hours | Setup logs |
Inconsistent execution | Specialized software development lifecycle subagents | Lower task variance or rework | Comparable task samples |
Fragmented connections | MCP integrations | Less integration maintenance | Maintenance records |
Limited usage visibility | Desktop token/configuration management | Better usage-cost attribution | Reconciled usage records |
Inconsistent checks | Available security checks | Better coverage and remediation visibility | Check reports |
Cross-tool friction | Cross-platform CLI and documented integrations | Lower setup or migration effort | Timed setup tasks |
Uneven review | Planning, testing, and review workflows | Lower review effort, stable quality | Review and defect data |
MCP means Model Context Protocol, a standard for connecting AI applications with tools and data. CLI means command-line interface.
Token visibility does not establish enforced budgets, throttling, or model routing. Security checks do not imply compliance certification, sandboxing, or guaranteed policy enforcement.
Likewise, a cross-platform CLI does not prove feature parity across coding assistants. Verify current Claude Code, Codex, and GitHub Copilot support individually. MCP support does not establish availability of every external integration.
When standardization is likely to improve ROI
Consider a bounded test when:
- Teams repeatedly recreate workflows.
- Setup and training consume measurable time.
- Multiple tools create configuration inconsistency.
- Integration maintenance or usage attribution is difficult.
- Review quality varies across comparable tasks.
Measure before and after, including the added tooling’s own setup, training, and recurring cost. Reduced overhead remains a hypothesis until validated.
When more tooling will not solve the problem
Additional tooling cannot independently repair weak testing, fragile continuous integration and delivery pipelines, unclear ownership, poor task scoping, or architectural problems. Missing baselines and absent capacity-reallocation plans also undermine evaluation.
If standardization addresses a measured bottleneck, evaluate AgentKit’s product scope against one approved workflow before extending the investment.
Frequently asked questions
What are the main drivers of AI coding tool ROI?
AI coding tool ROI is determined by balancing total investment costs against realized business value, rather than mere speed or code volume. True return is driven by net time savings after deducting review overhead, defect remediation, and implementation costs, translated into actionable engineering capacity.
Does faster code generation automatically mean higher ROI?
No. Faster generation often leads to "review bottlenecks" where PR throughput stalls due to the complexity of auditing machine-generated code. Positive ROI requires net savings to survive review and rework, and recovered capacity to be redeployed into work finance recognizes.
How do I accurately measure the total cost of AI coding tools?
Total Cost of Ownership (TCO) includes direct subscription licenses, usage-based token overages, setup labor, formal training, governance and security audits, and administrative time. You must also account for the recurring "review overhead" cost required to maintain quality, ensuring these figures are not double-counted against productivity gains.
Are "active users" and "meaningfully active users" the same thing?
They are distinct. Define meaningful activity before measuring — recurring use in an approved workflow, not opening the tool once. Paid seats, eligible users, and pilot participants are different denominators, so state which one you are using.
Can I rank individual developers based on their AI tool usage?
You should avoid individual ranking. Metrics like prompt volume, suggestion acceptance, or AI-generated code share are poor indicators of performance and can encourage "gaming" the system. Focus instead on team-level delivery outcomes, such as cycle time, PR throughput, and escaped defects and change failure rate, to maintain psychological safety and focus on business value.
What is the primary reason AI coding tool pilots fail to show ROI?
Common causes include recovered time with no defined destination, overhead that erases gross savings, and benefits double-counted across capacity and expenditure. Without defining where saved time is applied—such as technical debt reduction or high-priority feature work—productivity gains often dissipate. Additionally, pilots often fail when teams ignore incremental review burdens or fail to factor in usage-based pricing volatility.
How do I translate "recovered engineering hours" into financial value?
To calculate realized productivity value, multiply the net hours saved (gross savings minus task-level overhead) by the loaded hourly cost of the engineering cohort, then apply a "realization rate." This rate reflects the percentage of saved time actually converted into completed high-value work or reduced expenditure, ensuring you avoid overstating financial impact.
Read more:
- Master a repeatable AI coding workflow for faster development
- AI project Bootstrap: A practical guide to building software
- Human in the loop AI coding: Optimize speed and quality
Conclusion
Calculating AI coding tools ROI requires a complete chain of evidence spanning full investment costs, meaningful adoption, net hours saved, safe delivery, and recognized financial value. Teams must distinguish recovered capacity from true expenditure reductions and evaluate consistent workflows using conservative economic assumptions.
Ultimately, expansion should be driven by supported outcomes and strict security gates rather than enthusiasm or code volume, with negative pilot results guiding workflow redesign or termination rather than automatic renewal.