Claude Code performance optimization: A measured workflow
Claude Code performance optimization: Commands, prompts and a measured workflow
Claude Code performance optimization means using Claude Code as an interactive engineering assistant to analyze runtime evidence, locate performance bottlenecks, and implement targeted application changes. Profiling and benchmarking remain essential: code inspection can suggest potential improvements, but only repeatable measurements establish whether a patch truly works. A cleaner-looking refactor can leave the measured operation just as slow.
This guide covers application latency, throughput, memory, and execution time-not Claude Code’s responsiveness or token consumption. Start with one operation, capture evidence, approve a narrow patch, and validate correctness alongside performance. Keep only changes that survive representative testing and review.
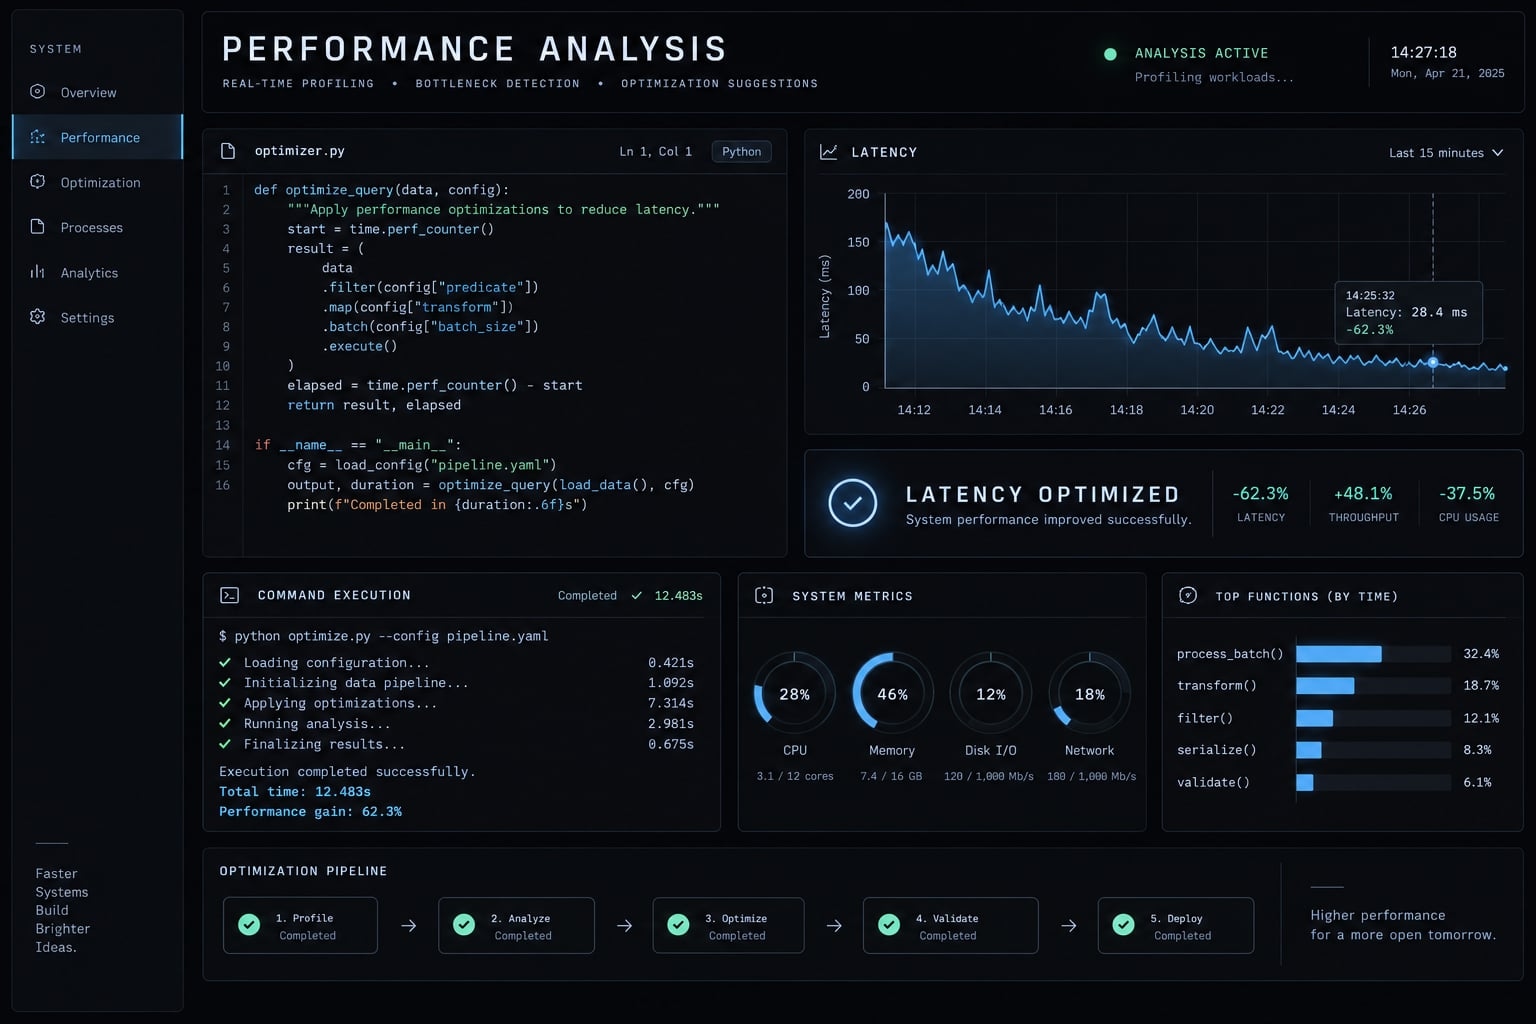
How to optimize code performance with Claude Code
A broad “make this faster” request invites speculative edits. Define the operation first, then give Claude Code evidence and acceptance criteria.
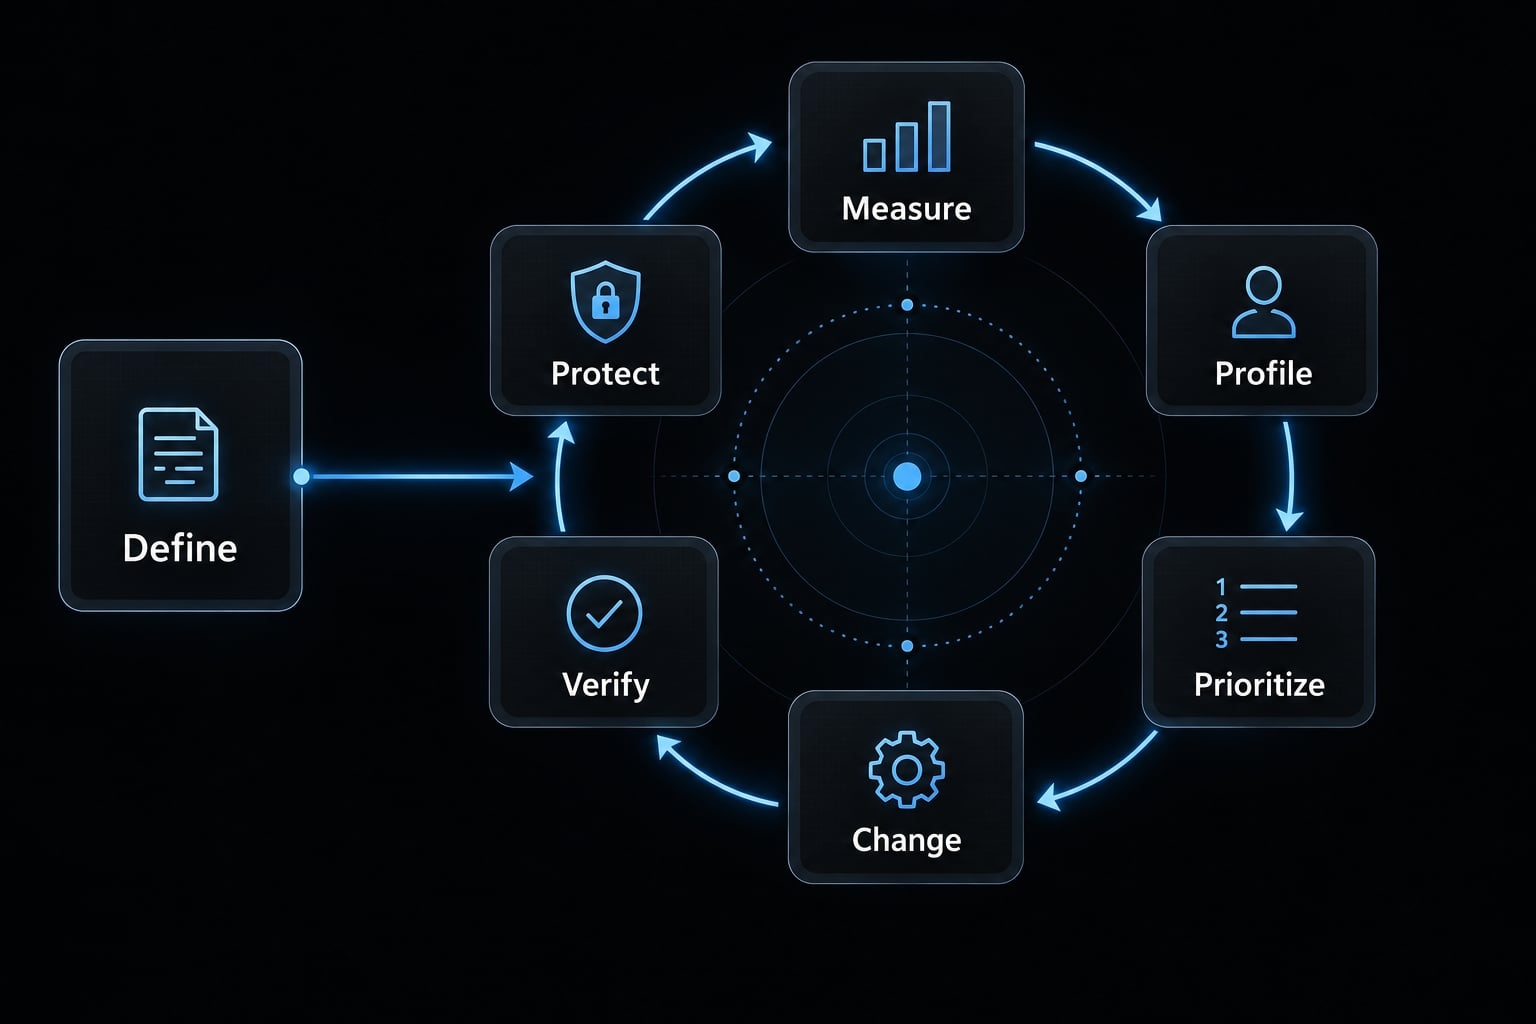
Stage | Developer action | Claude Code task | Required output |
|---|---|---|---|
Define | Select operation and metric | Clarify constraints | Acceptance criteria |
Measure | Run representative workload | Organize results | Performance baseline |
Profile | Collect runtime evidence | Rank supported bottlenecks | Prioritized hypotheses |
Change | Approve one hypothesis | Implement focused patch | Reviewable diff |
Verify | Repeat tests and benchmark | Compare results and trade-offs | Keep/revise/revert recommendation |
Protect | Set tolerance and ownership | Propose regression check | Repeatable guard |
Define establishes the target before the loop. Prioritization happens after profiling and before changes; it is not a separate competing process.
Define the performance target
A broad request like "make this faster" invites speculative edits. Define the operation, primary metric, representative inputs, and behavioral boundaries first.
For example: “Reduce GET /api/orders p95 latency-the latency at or below which 95% of requests complete (known as p95 latency) - from an illustrative 820 ms to below 500 ms, without changing authorization or responses.”
Capture a repeatable baseline
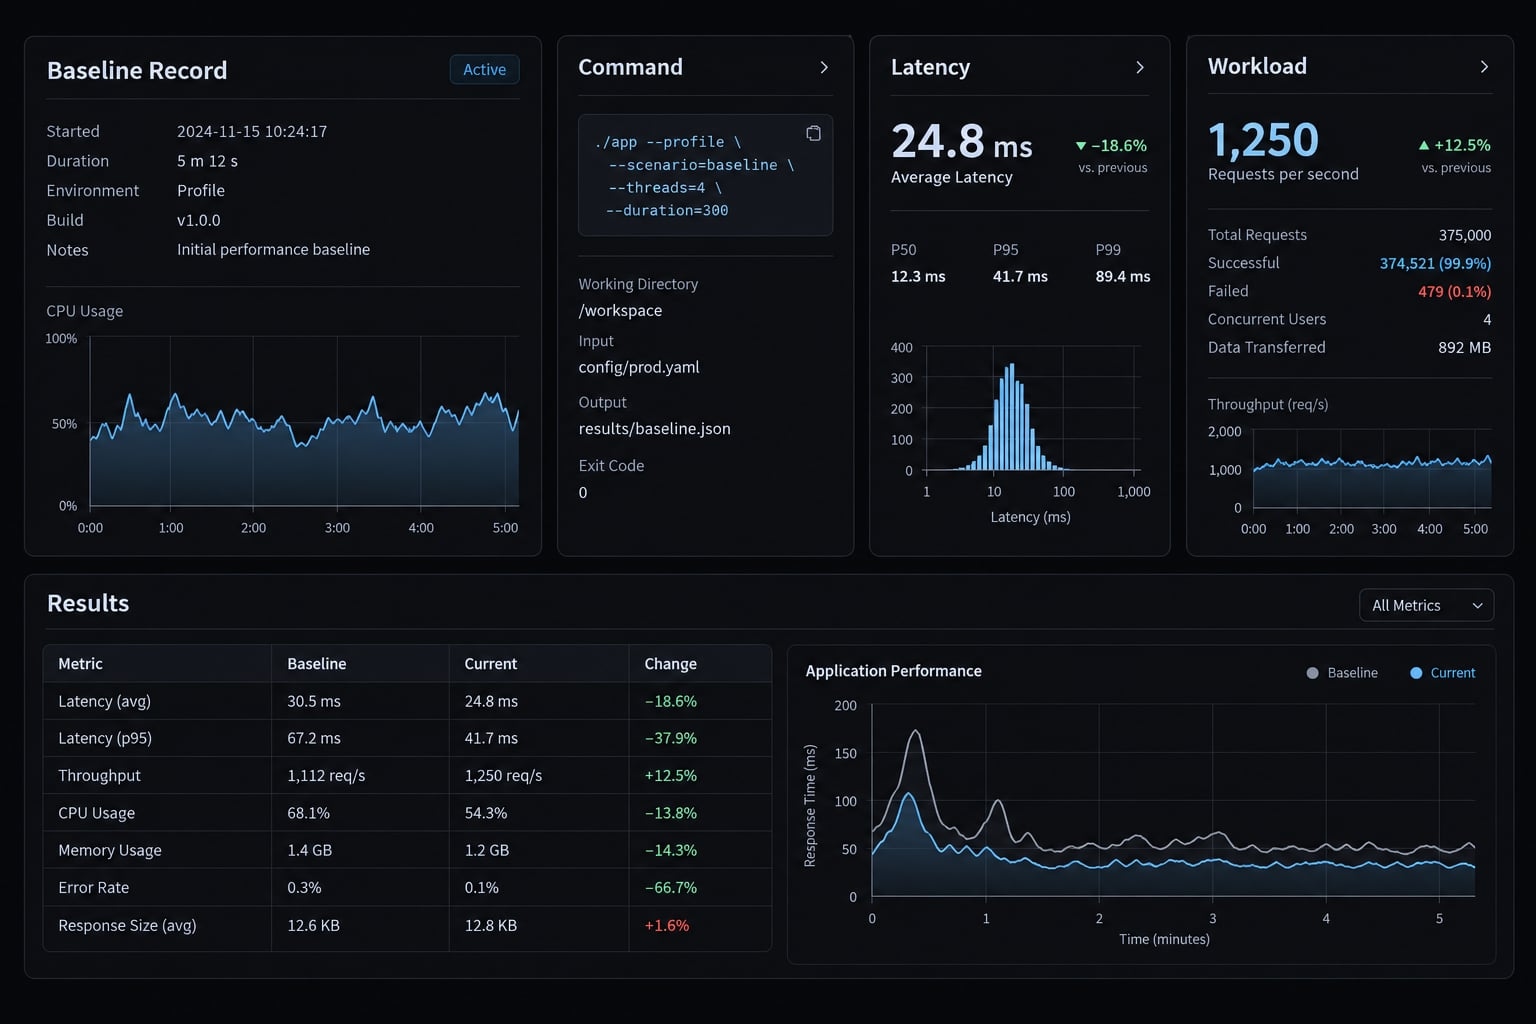
A baseline is the recorded pre-change result under specified conditions. A benchmark is a repeatable measurement of an operation or workload.
Record:
- Exact command and code revision.
- Runtime, operating system, and resource limits.
- Dataset, payloads, and concurrency.
- Warm-up and cache state.
- Repeated results and observed variability.
There is no universal repeat count. Adequate repetition depends on benchmark duration and variability.
Collect evidence before asking for changes
Profiling observes where runtime CPU cycles, memory, or network I/O are consumed. Use bottleneck analysis to separate symptoms from root causes.
Symptom | Useful evidence |
|---|---|
High CPU | CPU profile |
Rising memory | Allocation and retained-object evidence |
Slow database access | Query logs and execution plans |
Slow endpoint | Request traces |
Slow batch | Per-stage timings |
Prioritize, change, verify and protect
Rank candidates by likely impact and implementation risk. Approve one coherent optimization hypothesis, which may span several files.
Run functional tests, repeat the performance baseline, and compare primary and secondary metrics. Decide whether to keep, revise, or revert.
Finally, add a regression guard: a repeatable check that flags deterioration beyond an agreed tolerance. This makes an AI-assisted code optimization workflow reviewable rather than speculative.
Claude Code performance optimization commands and prompts
Claude Code commands launch the assistant; measurement commands generate evidence; prompts assign tasks. The official Claude Code documentation describes starting an interactive session from your repository:
claude
Paste the task prompts below into that session.
For a Python workload, run this measurement command separately in a safe development terminal:
python -m cProfile -s cumulative path/to/script.py
Prerequisites: Python, project dependencies, and a runnable script. Replace the path. Profiling adds overhead; these timings are not uninstrumented production latency. These examples are not presented as locally tested commands.
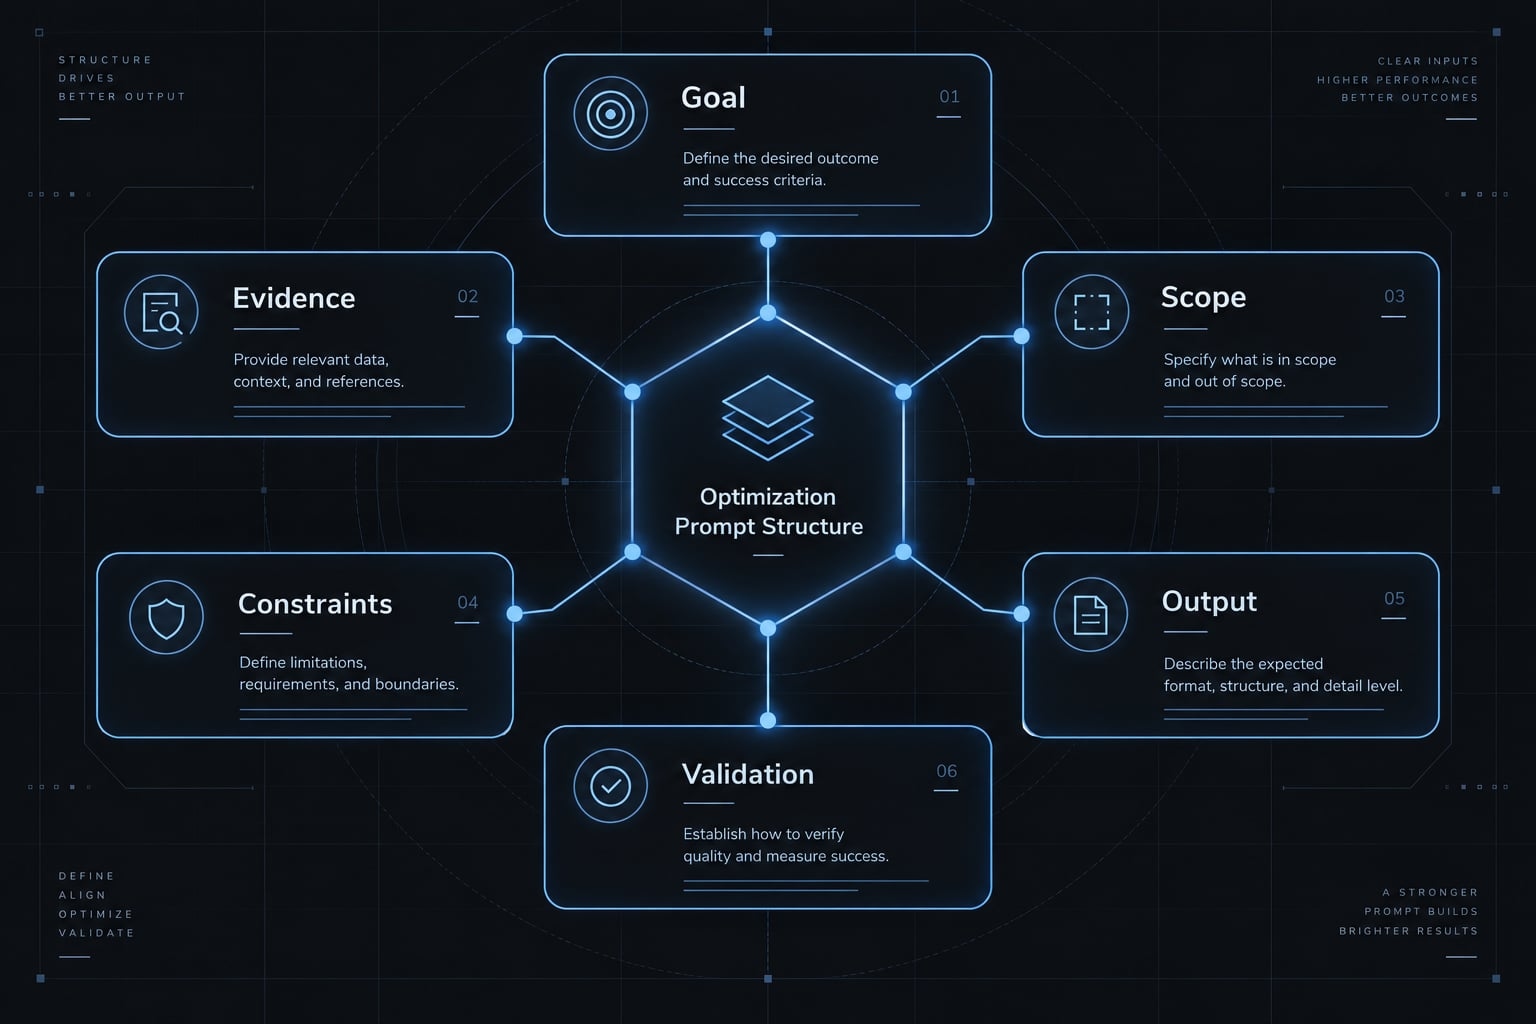
Standard Claude Code performance prompt structure
- Goal: Operation and desired metric.
- Evidence: Measurements, profiles, traces, or logs.
- Scope: Approved files and code paths.
- Constraints: Behavior and resource boundaries.
- Required output: Findings, patch proposal, and trade-offs.
- Validation: Tests and comparable benchmark.
Apply this shared instruction before any prompt:
Analyze before editing. Stay within approved scope and preserve behavior.Report missing evidence; never invent measurements.Request approval before implementation.
Problem-to-command mapping table
The final column describes a task prompt, not built-in Claude Code commands.
Symptom | Evidence to provide | Claude Code task |
|---|---|---|
Slow function | Inputs and timings | Inspect redundant work |
High CPU | CPU profile | Map hot paths to source |
Growing memory | Repeated memory observations | Investigate retention |
Slow endpoint | Traces and latency distribution | Locate request bottleneck |
Excessive queries | Logs, plans, calling code | Investigate N+1 |
Repeated I/O | Operation counts and stage timings | Propose bounded batching |
Poor scaling | Timings across input sizes | Review computational complexity |
For performance-critical code, give Claude Code the smallest relevant source area plus supporting evidence. Some profiler artifacts require export to text or a summarized report before interpretation.
Analyze a slow function
Use when a repeatable function benchmark is slow.
Inspect [function/file] using [benchmark command, results, representative input].Estimate computational complexity; identify redundant work.Rank evidence-supported candidates and propose the smallest change.List missing evidence and validation steps. Do not edit yet.
Output and validation: Ranked proposal; run functional tests and same-input benchmarks. Compare at least two input sizes when scaling matters.
Find CPU bottlenecks
Use when CPU evidence identifies expensive execution paths.
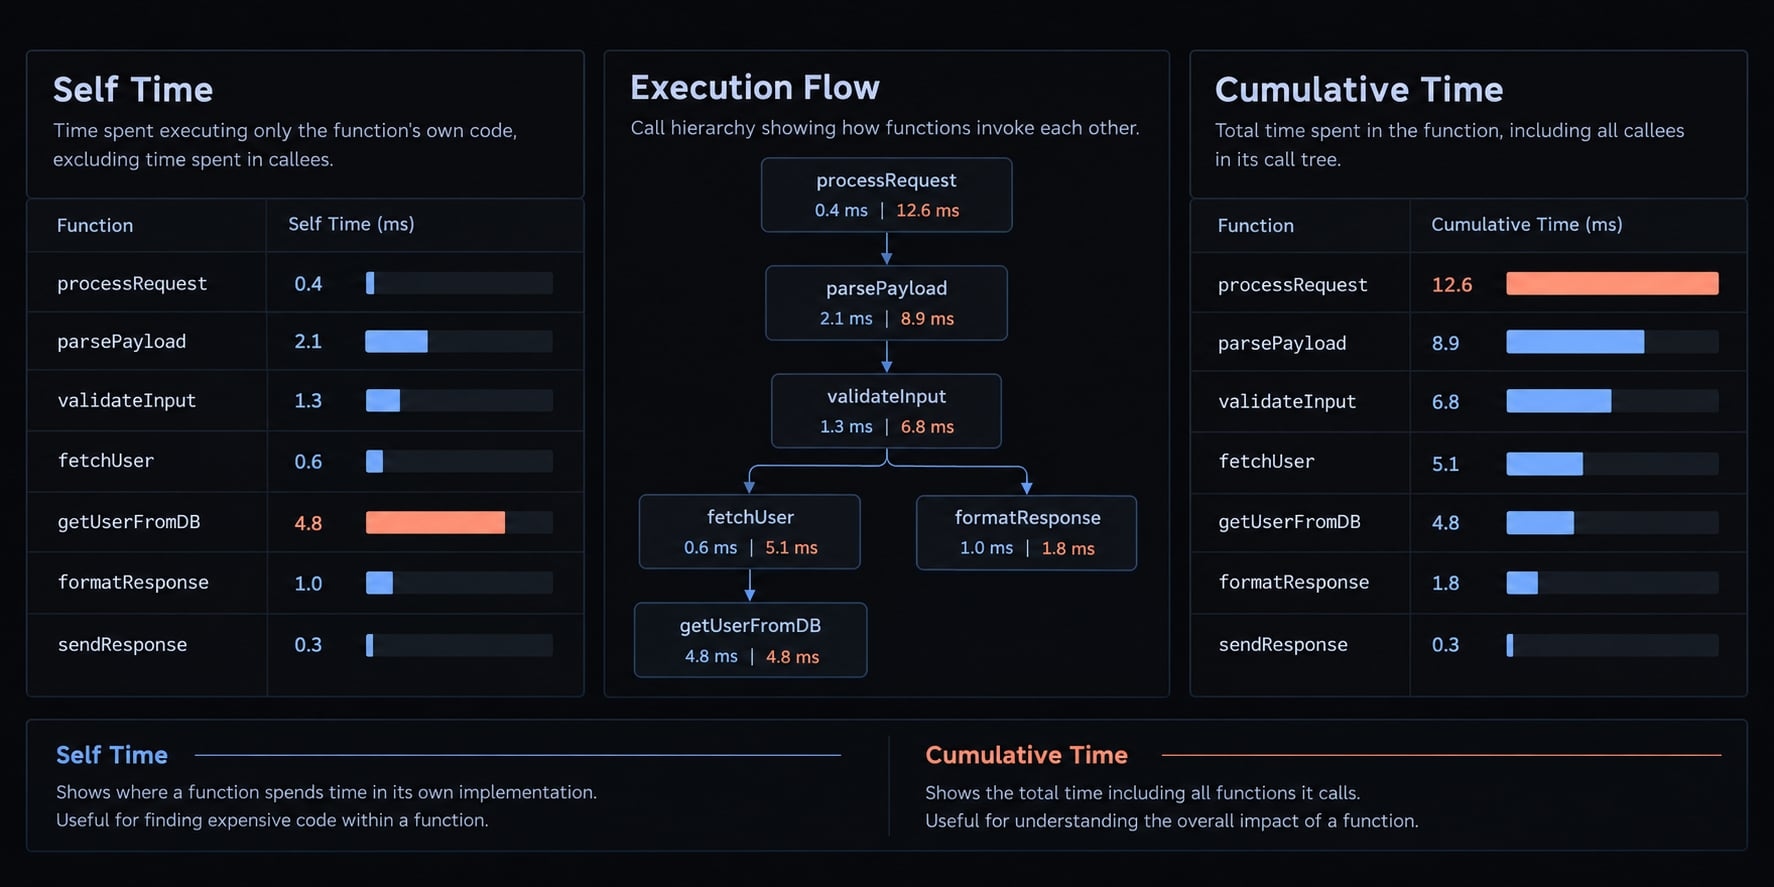
Analyze [profile artifact] and map hot paths to [source files].Distinguish self time from cumulative time where available.Explain likely causes and low-risk options.Report sampled-time percentages only if supported; otherwise say unavailable.Propose runtime and CPU comparisons before edits.
Output and validation: Source-linked findings; compare elapsed runtime and CPU measurements. A wide flame-graph frame does not prove all its time is avoidable.
Investigate high memory usage
Use for sustained growth or excessive allocation, including memory leak detection.
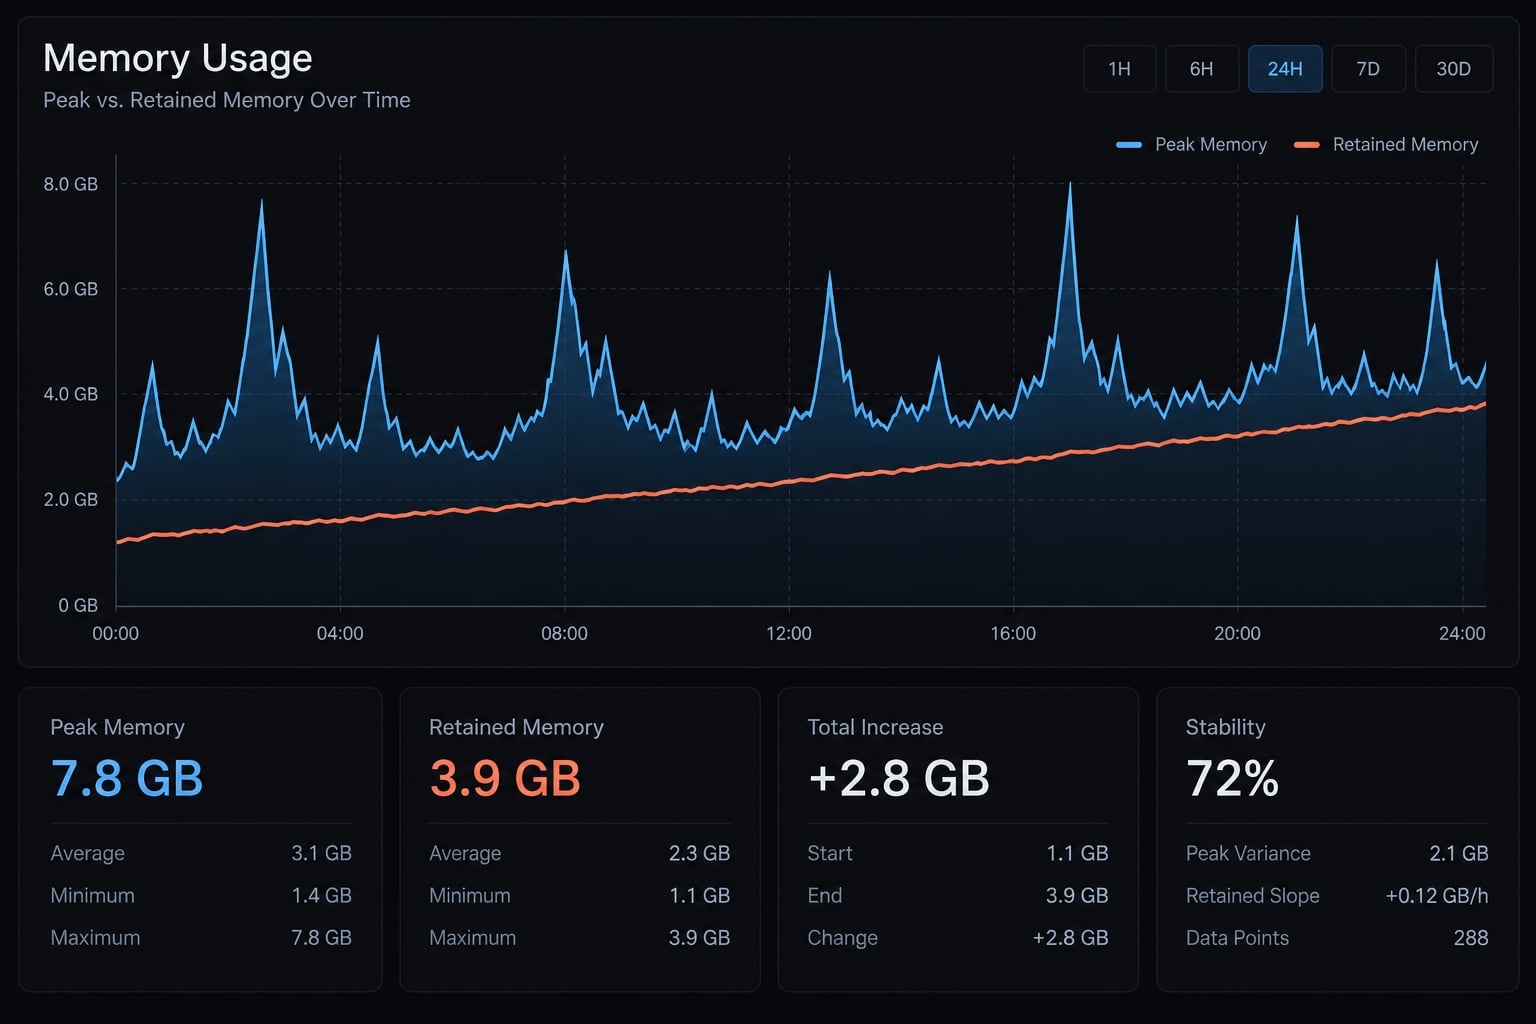
Review [allocation evidence, retained objects, repeated workload observations].Separate allocation volume, peak memory, and retained memory.Rank candidate causes and explain memory/latency trade-offs.Do not introduce unbounded caches.Propose repeated-load validation before editing.
Output and validation: Evidence-backed hypotheses; compare peak and retained memory at equivalent workload checkpoints. A single large heap or temporary spike does not establish a leak.
Optimize a slow API endpoint
Use for API response time optimization supported by request evidence.
Analyze [endpoint/file], [traces], [latency distribution], and [query count].Use [representative payloads and concurrency].Preserve authorization, tenant isolation, schema, ordering, and error semantics.Do not sum overlapping spans.Rank causes and propose comparable-load latency/error validation before edits.
Output and validation: Request-path proposal; compare latency and errors at equivalent load. Discuss tail latency only when the sample supports it.
Detect N+1 and inefficient database queries
Use when logs show repeated statements or substantial database time.
Inspect [query logs, execution plans, calling code, execution frequency].Assess repeated lookups and candidate batching, eager loading, or indexing.Preserve access boundaries and behavior.Explain workload assumptions and index write/storage costs.Propose query-count, database-time, and load comparisons before changes.
Output and validation: Database query optimization proposal tied to evidence. Query count means statements executed for the measured operation.
Not every full scan is inefficient. Plan interpretation depends on table size, selectivity, and workload. PostgreSQL’s Using EXPLAIN notes that EXPLAIN ANALYZE executes the statement; use database-specific guidance and a safe environment.
Reduce repeated file or network I/O
Use when file or network input/output dominates elapsed time.
Review [stage timings, repeated operations, request counts, failures].Assess batching, reuse, and bounded concurrency.Preserve freshness, rate limits, retries, and failure handling.Describe resource limits and cancellation behavior.Propose elapsed-time, request-count, and failure comparisons before editing.
Output and validation: Bounded proposal; compare elapsed time and failures under representative load. Faster individual requests must not exhaust shared connections or downstream capacity.
Review algorithmic complexity
Use when runtime grows sharply with input size.
Inspect [code] against [current/future input sizes and timing results].Identify nested scans, repeated sorting, and data-structure alternatives.Estimate computational complexity and state assumptions.Preserve ordering, duplicates, and edge-case behavior.Propose multi-size benchmarks before edits.
Output and validation: Scaling hypothesis and focused alternative; measure several input sizes. Better asymptotic complexity may still lose at current sizes because of overhead.
Verify an optimization and add regression protection
Use after an approved patch and functional tests.
Compare [baseline/post-change results], [test results], and [diff].Report absolute and percentage changes, variability, and trade-offs.Recommend keep, revise, or revert.Do not claim gains within ordinary variability.Propose a regression guard with an explicit tolerance and stable workload.
For lower-is-better metrics, reduction is (before − after) / before × 100%. For higher-is-better metrics, increase is (after − before) / before × 100%. Do not calculate percentages from a zero baseline.
Keep a benchmark record beside the diff:
Field | Record |
|---|---|
Operation and metric | Target path, units, acceptance threshold |
Commands | Benchmark, profiler, functional tests |
Environment | Date, revision, runtime/tool versions, resources |
Workload | Dataset, payloads, concurrency, warm-up, caches |
Results | Before/after values, repetitions, variability |
Decision | Reviewer, trade-offs, limitations, keep/revise/revert |
Missing fields remain “not recorded.” An incomplete record is more useful than fabricated certainty.
Example End-to-End optimization workflow
This practical illustration—not a measured case study—simulates how to optimize a B2B SaaS order-management endpoint. Every numerical result below is synthetic.
Symptom and baseline
GET /api/orders returns 100 orders. Assume one list query followed by one customer lookup per order, without effective deduplication or reuse.
Metric | Illustrative baseline | Illustrative target |
|---|---|---|
Returned orders | 100 | Preserve response |
Query count | 101 | Remove per-order lookup pattern |
p95 latency | 820 ms | Below 500 ms |
Observed errors | 0 in synthetic sample | No increase |
Suppose the illustrative query log shows repeated customer reads:
SELECT ... FROM orders WHERE tenant_id = ? ...SELECT ... FROM customers WHERE tenant_id = ? AND id = ? ...-- Customer lookup repeated once per returned order
Trace evidence would need to show that these reads materially contribute to request time. Query-count growth supports an N+1 hypothesis; it does not establish the latency benefit of fixing it.
Claude Code analysis instruction
Analyze [orders endpoint file], [redacted trace/query log], and [existing tests].Scope: order retrieval and customer loading only.Before edits, rank findings and propose a focused change plus benchmark plan.Preserve access boundaries and observable behavior.
Focused optimization
A candidate patch collects distinct customer identifiers, fetches authorized customers in a batch, and maps them back to orders.
It must preserve response schema, authorization, tenant boundaries, ordering, missing-related-record behavior, and errors. Appropriate eager loading is another option; consult the actual database-access library’s documentation.
Batching can increase memory or change query plans. PostgreSQL’s Using EXPLAIN provides guidance for examining plan behavior, not proof that batching is automatically faster.
Verification and decision
Illustrative values only; no benchmark was executed.
Metric | Before | Candidate after |
|---|---|---|
Query count | 101 | 2 |
p95 latency | 820 ms | 540 ms |
Observed errors | 0 | 0 |
Peak memory | Not recorded | Not recorded |
The example’s latency reduction is 280 ms, approximately 34.1%, but the target remains unmet. Unknown memory costs also prevent acceptance.
The illustrative decision is revise and measure further, not “keep.” In a real run, verify correctness, repeatability, resource trade-offs, and remaining bottlenecks before accepting the patch.
How to keep Claude Code optimizations safe
Safety requires instructions, enforced permissions, and human review. Prompt constraints alone are not a sandbox.
Use a safe optimization contract
Analyze first; obtain approval before implementation.Edit only approved paths. Preserve interfaces and behavior.Use no production credentials or customer data.Do not access excluded files or environments.No destructive commands or production mutations without explicit authorization.Request separate approval for schema, indexes, architecture, caches, or concurrency.Stop and report missing evidence, tooling, or permissions.Run approved tests and benchmarks; report failures and trade-offs.Keep the patch isolated and reversible.
Configure access restrictions separately using Claude Code permission controls and environment boundaries. Tool execution depends on installed tooling, access, permissions, and configuration.
Review the diff, not only the result
Use code review to check for:
- Unrelated files or abstractions.
- Removed validation or correctness checks.
- Changed authorization or tenant filtering.
- Unbounded concurrency.
- Caches without ownership, freshness, or invalidation rules.
- Changed logging or error handling.
Scope control means rejecting unrelated cleanup, even when it looks reasonable. A cache can remove repeated work while introducing stale results.
Benchmark under comparable conditions
Use the same workload, environment, warm-up, and cache state. Repeat runs and inspect secondary metrics, including errors, memory, and shared-resource usage.
Instrumented profiling can add overhead. Measure final performance without profiling when appropriate. A microbenchmark gain that disappears under representative load is not sufficient evidence.
Tie automated regression testing to a stable workload and an agreed tolerance rather than a fragile single-run threshold.
Know when to revert
Revert an unaccepted patch when:
- Functional tests fail.
- Improvement is inconsistent.
- Resource or operational trade-offs are unacceptable.
- Benchmark conditions are unrealistic.
- Maintenance cost exceeds demonstrated benefit.
Reverting a local patch differs from rolling back deployment. A rollback plan must account for persistent schema and data effects. Faster execution alone does not establish production readiness.
Claude Code vs. Traditional profiling tools
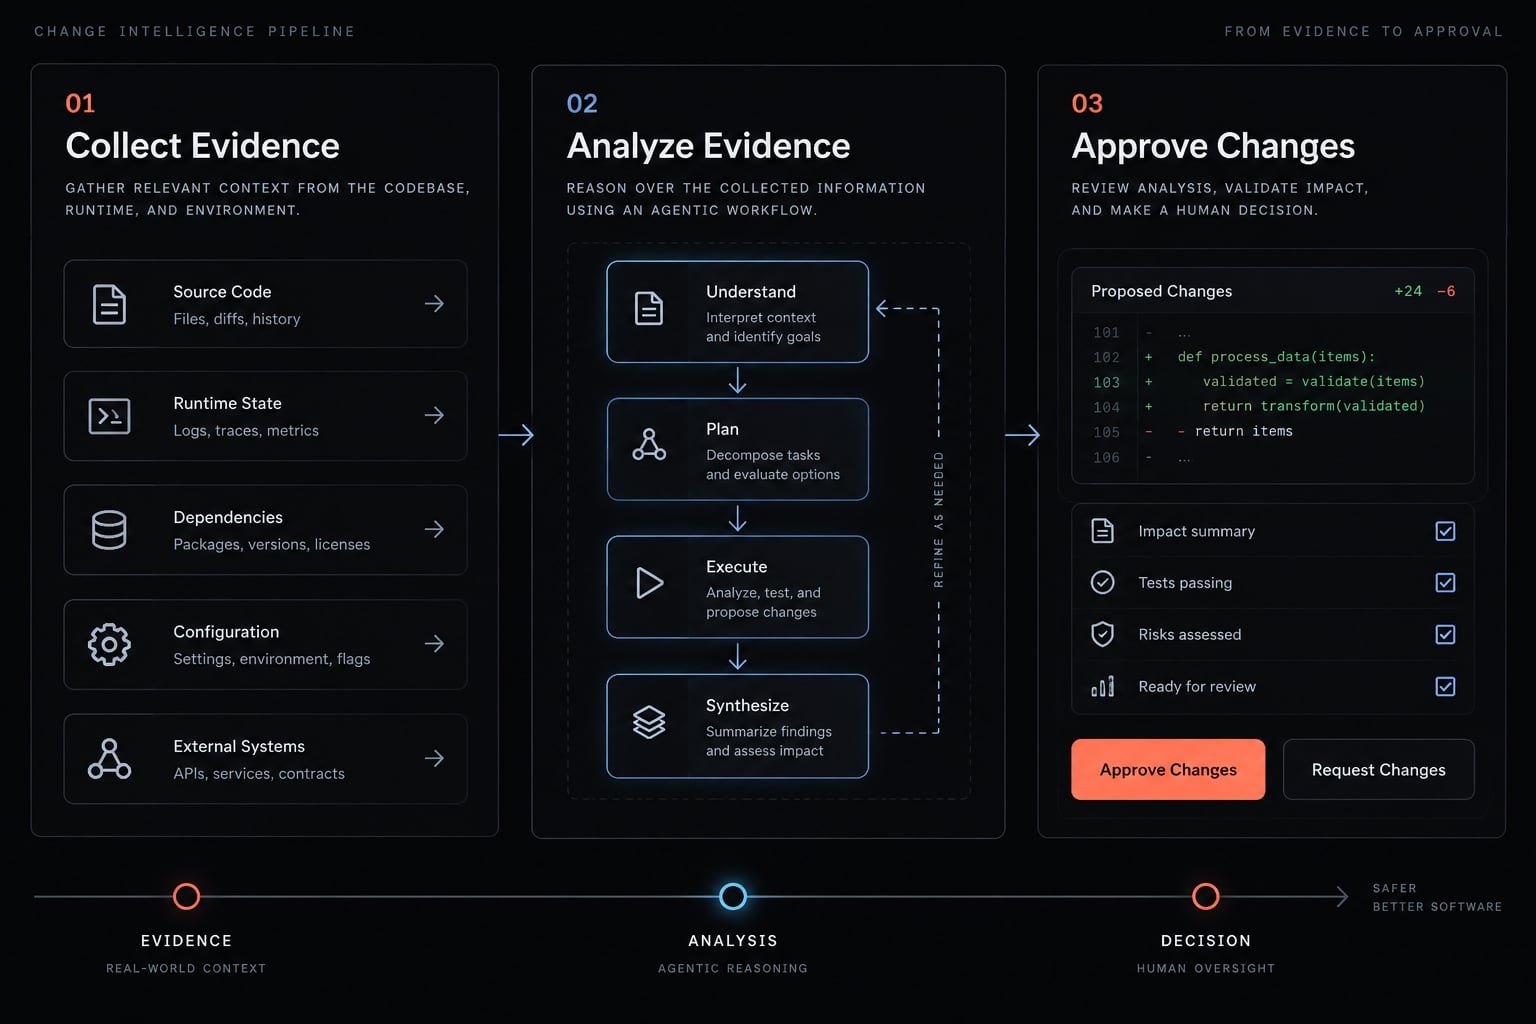
Claude Code does not replace profilers, APM tools, or benchmarking suites. They play complementary roles in an engineering ecosystem.
Capability | Claude Code | Profiler or APM | Benchmark tool | Human reviewer |
|---|---|---|---|---|
Collect evidence | Can invoke configured tools with permission | Records runtime behavior | Executes defined workload | Approves collection scope |
Locate bottlenecks | Connects evidence to code | Provides measurements and diagnostic clues | Shows workload sensitivity | Checks interpretation |
Explain causes | Proposes hypotheses | Exposes traces and correlations | Tests comparative behavior | Challenges assumptions |
Implement changes | Edits approved code | Informs intervention | Does not usually edit code | Reviews diff |
Validate improvement | Summarizes results | Shows resource effects | Measures comparable performance | Assesses significance |
Accept change | Recommends decision | Supplies operational evidence | Supplies benchmark evidence | Owns acceptance and maintainability |
Reuse the optimization workflow across projects
Project-Level instruction template
Reuse general rules, but keep commands and acceptance thresholds repository-specific. A project instruction file can hold this compact template:
Operation and acceptance threshold:Approved benchmark and functional-test commands:Relevant directories:Protected interfaces and behavior:Required evidence: baseline, profile, diff, repeated resultsReport: findings, assumptions, trade-offs, decisionApproval checkpoints: plan, implementation, acceptanceExcluded files, data, credentials, and environments:Revert criteria:Reviewer and regression-test owner:
Populate every field before execution. A reusable Claude Code skill should require missing repository details rather than silently adopting another project’s assumptions.
Automated performance testing becomes useful when its environment, workload, and tolerance are maintained. Reusing a prompt does not make an unstable benchmark reliable.
Keep the report beside the code revision so another developer can reproduce the decision.
Optional AgentKit workflow
To reuse this workflow across projects, AgentKit provides editable skills and chained commands — /ak:plan, /ak:cook, /ak:code-review — that you can adapt to include the baseline, benchmark, and approval steps above. It's a commercial kit with full source access and production support for Claude Code and Codex. It structures the process; benchmarks, permissions, and human review still decide what ships.
Frequently asked questions
Is Claude Code a replacement for traditional profiling tools?
No, Claude Code is complementary to tools like cProfile or Datadog. Traditional profilers provide the objective runtime measurements (such as CPU hot paths or memory allocation data) required to identify bottlenecks, while Claude Code helps analyze that evidence to propose and implement targeted code optimizations.
How do I ensure my Claude Code optimizations are safe?
Always enforce a strict optimization contract: analyze first, obtain human approval on the proposed diff, execute functional tests, and re-run benchmarks under identical conditions before merging any code.
What should I do if an optimization doesn't improve performance?
If a patch does not yield a statistically significant improvement or introduces secondary resource trade-offs (such as increased memory consumption), revert the change immediately. Always rely on empirical benchmark data over the AI's confidence score.
Read more:
- Claude Code subagents documentation: Setup and usage guide
- How to create a Claude Code skill: Step-by-step tutorial
- Mastering the Claude Code workflow for reliable AI development
Conclusion
Claude Code performance optimization works best as a controlled engineering process. Claude Code supports analysis and implementation; profiling identifies where to investigate, and benchmarks establish whether a patch helped. Neither plausible reasoning nor a cleaner diff proves an improvement.
Review determines whether the change preserves behavior and remains maintainable. Regression protection helps preserve the benefit after acceptance. When results overlap ordinary variability, gather better evidence rather than declaring success.
Start with one slow operation, one primary metric, and one repeatable benchmark. Approve the smallest evidence-supported intervention, then compare correctness, performance, and resource trade-offs.
Save the checklist and baseline template before your next optimization task. Let comparable measurements-not confidence-decide which changes remain.